Producer Price Indexes by Industry
- data.gov.au
- data.wu.ac.at
Updated Aug 9, 2023+ more versions Share
Share Facebook
 Twitter
 EmailClick to copy linkLink copiedCiteAustralian Bureau of Statistics (2023). Producer Price Indexes by Industry [Dataset]. https://data.gov.au/data/dataset/producer-price-indexes-by-industryDataset updatedAug 9, 2023License
Attribution 3.0 (CC BY 3.0)https://creativecommons.org/licenses/by/3.0/
License information was derived automaticallyDescriptionContains a range of producer price indexes. Firstly, economy-wide indexes are presented within a Stage of Production (SOP) framework, followed by a set of partial, stand-alone measures relating to specific industry sectors of the economy (selected manufacturing, construction, mining and service industries).
- J
Japan PPI: Metal: SW: WP: Wire Rope & Steel Stands for Prestress Concrete
- ceicdata.com
ShareFacebookTwitterEmailClick to copy linkLink copiedCiteCEICdata.com, Japan PPI: Metal: SW: WP: Wire Rope & Steel Stands for Prestress Concrete [Dataset]. https://www.ceicdata.com/en/japan/producer-price-index-2010100-metal-products/ppi-metal-sw-wp-wire-rope--steel-stands-for-prestress-concreteDataset provided byCEICdata.comLicenseAttribution 4.0 (CC BY 4.0)https://creativecommons.org/licenses/by/4.0/
License information was derived automaticallyTime period coveredJan 1, 2016 - Dec 1, 2016Area coveredJapanVariables measuredProducer PricesDescriptionJapan PPI: Metal: SW: WP: Wire Rope & Steel Stands for Prestress Concrete data was reported at 114.700 2010=100 in Dec 2016. This stayed constant from the previous number of 114.700 2010=100 for Nov 2016. Japan PPI: Metal: SW: WP: Wire Rope & Steel Stands for Prestress Concrete data is updated monthly, averaging 50.200 2010=100 from Jan 1980 (Median) to Dec 2016, with 444 observations. The data reached an all-time high of 117.800 2010=100 in Jul 2014 and a record low of 43.100 2010=100 in Mar 1980. Japan PPI: Metal: SW: WP: Wire Rope & Steel Stands for Prestress Concrete data remains active status in CEIC and is reported by Bank of Japan. The data is categorized under Global Database’s Japan – Table JP.I087: Producer Price Index: 2010=100: Metal Products.
- T
United States Producer Prices
- tradingeconomics.com
- fa.tradingeconomics.com
- +13more
csv, excel, json, xmlUpdated Aug 18, 2015ShareFacebookTwitterEmailClick to copy linkLink copiedCiteTRADING ECONOMICS (2015). United States Producer Prices [Dataset]. https://tradingeconomics.com/united-states/producer-pricesexcel, csv, xml, jsonAvailable download formatsDataset updatedAug 18, 2015Dataset authored and provided byTRADING ECONOMICSLicenseAttribution 4.0 (CC BY 4.0)https://creativecommons.org/licenses/by/4.0/
License information was derived automaticallyTime period coveredNov 30, 2009 - May 31, 2025Area coveredUnited StatesDescriptionProducer Prices in the United States increased to 148.07 points in May from 147.88 points in April of 2025. This dataset provides the latest reported value for - United States Producer Prices - plus previous releases, historical high and low, short-term forecast and long-term prediction, economic calendar, survey consensus and news.
European Union Producer Price Index Growth
- ceicdata.com
- dr.ceicdata.com
Updated Feb 15, 2025ShareFacebookTwitterEmailClick to copy linkLink copiedCiteCEICdata.com (2025). European Union Producer Price Index Growth [Dataset]. https://www.ceicdata.com/en/indicator/european-union/producer-price-index-growthDataset updatedFeb 15, 2025Dataset provided byCEIC DataLicenseAttribution 4.0 (CC BY 4.0)https://creativecommons.org/licenses/by/4.0/
License information was derived automaticallyTime period coveredJun 1, 2022 - May 1, 2023Area coveredEurope, European UnionDescriptionKey information about European Union Producer Price Index Growth
- European Union Producer Price Index (PPI) dropped -1.6 % YoY in May 2023, compared with a growth of 0.7 % YoY in the previous month.
- EU Producer Price Index data is updated monthly, available from Jan 1997 to May 2023, with an average change of 1.7 % YoY.
- The data reached an all-time high of 35.3 % YoY in Aug 2022 and a record low of -6.8 % YoY in Jul 2009.
CEIC calculates Producer Price Index Growth from monthly Producer Price Index. Eurostat provides Producer Price Index with base 2015=100. Producer Price Index Growth prior to January 2001 is calculated from Producer Price Index with base 2010=100 that includes United Kingdom. European Union stands for EU27 excluding UK.- T
United States Producer Price Inflation MoM
- tradingeconomics.com
- pt.tradingeconomics.com
- +12more
csv, excel, json, xmlUpdated Jun 12, 2025ShareFacebookTwitterEmailClick to copy linkLink copiedCiteTRADING ECONOMICS (2025). United States Producer Price Inflation MoM [Dataset]. https://tradingeconomics.com/united-states/producer-price-inflation-momcsv, xml, json, excelAvailable download formatsDataset updatedJun 12, 2025Dataset authored and provided byTRADING ECONOMICSLicenseAttribution 4.0 (CC BY 4.0)https://creativecommons.org/licenses/by/4.0/
License information was derived automaticallyTime period coveredDec 31, 2009 - May 31, 2025Area coveredUnited StatesDescriptionProducer Price Inflation MoM in the United States increased to 0.10 percent in May from -0.20 percent in April of 2025. This dataset includes a chart with historical data for the United States Producer Price Inflation MoM.
- f
Coevolution between PPI partners detected using correlated changes in...
- plos.figshare.com
xlsUpdated Jun 2, 2023ShareFacebookTwitterEmailClick to copy linkLink copiedCiteÅsa Pérez-Bercoff; Corey M. Hudson; Gavin C. Conant (2023). Coevolution between PPI partners detected using correlated changes in selective constraint. [Dataset]. http://doi.org/10.1371/journal.pone.0052581.t001xlsAvailable download formatsUnique identifierhttps://doi.org/10.1371/journal.pone.0052581.t001Dataset updatedJun 2, 2023Dataset provided byPLOS ONEAuthorsÅsa Pérez-Bercoff; Corey M. Hudson; Gavin C. ConantLicenseAttribution 4.0 (CC BY 4.0)https://creativecommons.org/licenses/by/4.0/
License information was derived automaticallyDescriptionaValues of branch-wise selective constraint (ω) allowed in the computation of Spearman’s correlation between these ω values between paired branches for two proteins with a known PPI in humans (Methods).bValues of ω from the indicated clades were removed before the calculation of the Spearman’s correlation.cWe required at least 6 common branches between the two orthologous genes trees for the two interacting proteins: the column indicates the number of PPIs meeting this requirement.dP-value of the hypothesis test that the real PPI pairs had a higher mean Spearman’s correlation than would be expected, given the distribution of correlations seen from 1000 simulations of the same number of pseudo-PPI pairs drawn from non-interacting proteins (Methods).eMean of the mean correlation seen from 1000 simulations, each consisting of the same number of pseudo-PPIs from c.
- f
Phenotypic plasticity index (PPI) measured for non-rooted branches, and...
- plos.figshare.com
xlsUpdated May 30, 2023ShareFacebookTwitterEmailClick to copy linkLink copiedCiteCheng-Yuan Xu; Shon S. Schooler; Rieks D. Van Klinken (2023). Phenotypic plasticity index (PPI) measured for non-rooted branches, and connected and severed ramets. [Dataset]. http://doi.org/10.1371/journal.pone.0035873.t004xlsAvailable download formatsUnique identifierhttps://doi.org/10.1371/journal.pone.0035873.t004Dataset updatedMay 30, 2023Dataset provided byPLOS ONEAuthorsCheng-Yuan Xu; Shon S. Schooler; Rieks D. Van KlinkenLicenseAttribution 4.0 (CC BY 4.0)https://creativecommons.org/licenses/by/4.0/
License information was derived automaticallyDescriptionThe mean phenotypic plasticity (MPP) of all traits was calculated and compared among the branches and the ramets. MPP values accompanied by different letters are significantly different at P = 0.05 level when compared in pairs (Wilcoxon signed-rank test).
- F
Producer Price Index by Commodity: Metals and Metal Products
- fred.stlouisfed.org
jsonUpdated Jun 12, 2025+ more versionsShareFacebookTwitterEmailClick to copy linkLink copiedCite(2025). Producer Price Index by Commodity: Metals and Metal Products [Dataset]. https://fred.stlouisfed.org/series/WPU10jsonAvailable download formatsDataset updatedJun 12, 2025Licensehttps://fred.stlouisfed.org/legal/#copyright-public-domainhttps://fred.stlouisfed.org/legal/#copyright-public-domain
DescriptionGraph and download economic data for Producer Price Index by Commodity: Metals and Metal Products (WPU10) from Jan 1926 to May 2025 about metals, commodities, PPI, inflation, price index, indexes, price, and USA.
- N
NEMO Error Detection: PPI Connectivity analysis
- neurovault.org
niftiUpdated Mar 17, 2025+ more versionsShareFacebookTwitterEmailClick to copy linkLink copiedCite(2025). NEMO Error Detection: PPI Connectivity analysis [Dataset]. http://identifiers.org/neurovault.image:898341niftiAvailable download formatsUnique identifierhttps://identifiers.org/neurovault.image:898341Dataset updatedMar 17, 2025LicenseCC0 1.0 Universal Public Domain Dedicationhttps://creativecommons.org/publicdomain/zero/1.0/
License information was derived automaticallyDescriptionMean correlation with ACC seed for error > no-error connectivity analysis.
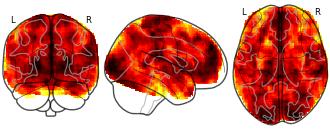
Collection description
This study examines error detection in life sciences students in a 100-level life sciences course.
Subject species
homo sapiens
Modality
fMRI-BOLD
Analysis level
group
Cognitive paradigm (task)
None / Other
Map type
Z
- T
United States - Producer Price Index by Industry: Ball and Roller Bearing...
- tradingeconomics.com
csv, excel, json, xmlUpdated Apr 29, 2020ShareFacebookTwitterEmailClick to copy linkLink copiedCiteTRADING ECONOMICS (2020). United States - Producer Price Index by Industry: Ball and Roller Bearing Manufacturing: Mounted Bearings (Excluding Plain) [Dataset]. https://tradingeconomics.com/united-states/producer-price-index-by-industry-ball-and-roller-bearing-manufacturing-mounted-bearings-except-plain-fed-data.htmljson, xml, excel, csvAvailable download formatsDataset updatedApr 29, 2020Dataset authored and provided byTRADING ECONOMICSLicenseAttribution 4.0 (CC BY 4.0)https://creativecommons.org/licenses/by/4.0/
License information was derived automaticallyTime period coveredJan 1, 1976 - Dec 31, 2025Area coveredUnited StatesDescriptionUnited States - Producer Price Index by Industry: Ball and Roller Bearing Manufacturing: Mounted Bearings (Excluding Plain) was 522.45500 Index Jun 1983=100 in May of 2025, according to the United States Federal Reserve. Historically, United States - Producer Price Index by Industry: Ball and Roller Bearing Manufacturing: Mounted Bearings (Excluding Plain) reached a record high of 522.45500 in May of 2025 and a record low of 28.50000 in April of 1967. Trading Economics provides the current actual value, an historical data chart and related indicators for United States - Producer Price Index by Industry: Ball and Roller Bearing Manufacturing: Mounted Bearings (Excluding Plain) - last updated from the United States Federal Reserve on July of 2025.
- T
United States Producer Prices Change
- tradingeconomics.com
- pl.tradingeconomics.com
- +13more
csv, excel, json, xmlUpdated Nov 29, 2024ShareFacebookTwitterEmailClick to copy linkLink copiedCiteTRADING ECONOMICS (2024). United States Producer Prices Change [Dataset]. https://tradingeconomics.com/united-states/producer-prices-changexml, csv, excel, jsonAvailable download formatsDataset updatedNov 29, 2024Dataset authored and provided byTRADING ECONOMICSLicenseAttribution 4.0 (CC BY 4.0)https://creativecommons.org/licenses/by/4.0/
License information was derived automaticallyTime period coveredJan 31, 1950 - May 31, 2025Area coveredUnited StatesDescriptionProducer Prices in the United States increased 2.60 percent in May of 2025 over the same month in the previous year. This dataset provides - United States Producer Prices Change - actual values, historical data, forecast, chart, statistics, economic calendar and news.
- T
Australia Producer Prices
- tradingeconomics.com
- it.tradingeconomics.com
- +14more
csv, excel, json, xmlUpdated Mar 15, 2025ShareFacebookTwitterEmailClick to copy linkLink copiedCiteTRADING ECONOMICS (2025). Australia Producer Prices [Dataset]. https://tradingeconomics.com/australia/producer-pricesxml, csv, excel, jsonAvailable download formatsDataset updatedMar 15, 2025Dataset authored and provided byTRADING ECONOMICSLicenseAttribution 4.0 (CC BY 4.0)https://creativecommons.org/licenses/by/4.0/
License information was derived automaticallyTime period coveredSep 30, 1998 - Mar 31, 2025Area coveredAustraliaDescriptionProducer Prices in Australia increased to 133 points in the fourth quarter of 2024 from 132 points in the third quarter of 2024. This dataset provides - Australia Producer Prices - actual values, historical data, forecast, chart, statistics, economic calendar and news.
Fitting results for scale-free model, and Clustering Coefficient and Mean...
- plos.figshare.com
xlsUpdated Jun 1, 2023ShareFacebookTwitterEmailClick to copy linkLink copiedCiteAntonio M. Rezende; Edson L. Folador; Daniela de M. Resende; Jeronimo C. Ruiz (2023). Fitting results for scale-free model, and Clustering Coefficient and Mean Shortest Path for PPIs compared against the same measure extracted from 1000 Random PPIs. [Dataset]. http://doi.org/10.1371/journal.pone.0051304.t003xlsAvailable download formatsUnique identifierhttps://doi.org/10.1371/journal.pone.0051304.t003Dataset updatedJun 1, 2023AuthorsAntonio M. Rezende; Edson L. Folador; Daniela de M. Resende; Jeronimo C. RuizLicenseAttribution 4.0 (CC BY 4.0)https://creativecommons.org/licenses/by/4.0/
License information was derived automaticallyDescriptionFitting results for scale-free model, and Clustering Coefficient and Mean Shortest Path for PPIs compared against the same measure extracted from 1000 Random PPIs.
- t
Data from: Heat transfer data of two-phase flow in a horizontal tube filled...
- service.tib.eu
Updated Aug 4, 2023+ more versionsShareFacebookTwitterEmailClick to copy linkLink copiedCite(2023). Heat transfer data of two-phase flow in a horizontal tube filled with metal sponge [Dataset]. https://service.tib.eu/ldmservice/dataset/rdr-doi-10-35097-1181Dataset updatedAug 4, 2023LicenseAttribution-NonCommercial 4.0 (CC BY-NC 4.0)https://creativecommons.org/licenses/by-nc/4.0/
License information was derived automaticallyDescriptionAbstract: In der hier vorgestellten Publikation werden experimentelle Daten zum Wärmeübergangs-koeffizienten beim gesättigten Strömungssieden von CO$_2$ in einem horizontalen zylindrischen Rohr (Durchmesser 14 mm) mit integrierten Metallschwämmen (offenzellige Metallschäume) präsentiert. Die nominelle Zelldichte der Schwämme betrug 10 ppi („Poren pro Zoll“) bzw. 20 ppi. Der Massenstrom wurde von 25 kg m$^{-2}$ s$^{-1}$ bis 125 kg m$^{-2}$ s$^{-1}$ variiert, der Strömungsdampfgehalt lag zwischen 10% und 100%. Der Sättigungsdruck betrug entweder 12 bar, 19 bar oder 26,5 bar. Die mit Schwämmen gefüllte Länge stromaufwärts der beheizten Zone betrug 38 mm beim 10 ppi Schwamm und entweder 35 mm oder 135 mm beim 20 ppi Schwamm. Für die 20 ppi Probe wurde der Anteil des mit Schwamm gefüllten Testabschnitts variiert, um Einlaufeffekte zu untersuchen. Als Referenz wurde der Wärmeübergangskoeffizient während des Strömungssiedens im leeren Rohr bestimmt. Darüber hinaus wurden die für den Wärme-übergangskoeffizient relevanten geometrische Eigenschaften der Schwämme (Fensterdurchmesser, Stegdurchmesser, Porosität, spezifische Oberfläche und Wärmeleitfähigkeit) ermittelt. Abstract: Experimental data on the heat transfer coefficient during saturated flow boiling of CO$_2$ in a horizontal cylindrical tube (diameter 14 mm) with integrated metal sponges (open-cell metal foams) are presented in this publication. The nominal cell density of the sponges was 10 ppi (“pores per inch”) or 20 ppi. The mass flux varied from 25 kg m$^{-2}$ s$^{-1}$ to 125 kg m$^{-2}$ $\,^{-1}$ and the vapor quality from 10% to 100%. The saturation pressure was either 12 bar, 19 bar or 26.5 bar. The length filled with sponge upstream of the heated part of the test section was 38 mm for the 10 ppi sponge and either 35 mm or 135 mm for the 20 ppi sponge. For the 20 ppi sample, the proportion of the test section filled with sponge was varied to investigate entrance effects. As a reference, the heat transfer coefficient during flow boiling in the empty tube was determined. In addition, geometric properties of the sponges relevant for the heat transfer coefficient (window diameter, strut diameter, porosity, specific surface area, and heat conductivity), were identified. TechnicalRemarks: # Sponges 10 ppi copper sponge made by replication technique total porosity: 91% open porosity: between 85% and 88% nominal cell density: approximately 10 pores per inch mean strut diameter: 0.45 mm mean window diameter: 1.6 mm 10 ppi plastic sponge made by 3D printing total and open porosity: 86% nominal cell density: approximately 10 pores per inch mean strut diameter: 0.6 mm mean window diameter: 2.0 mm 20 ppi copper sponge made by replication technique total porosity: 90% open porosity: between 84% and 87% nominal cell size: approximately 20 pores per inch mean strut diameter: 0.28 mm * mean window diameter: 1.0 mm Operating conditions two-phase flow boiling in test section filled with sponges pressure: 12 bar, 19 bar and 26.5 bar mass flux: 25 kg m-2 s-1 to 125 kg m-2 s-1 vapor quality: 10% to 100% heat flux: 3 kW m-2 to 65 kW m-2 * boundary condition: * constant wall temperature * constant wall heat flux two-phase flow boiling in empty tube pressure: 12 bar and 26.5 bar mass flux: 25 kg kg m-2 s-1 to 150 kg m-2 s-1 vapor quality: 10% to 100% heat flux: 1 kW m-2 to 40 kW m-2 * boundary condition: * constant wall temperature * constant wall heat flux
- f
Leave-one-out cross-validation results of all methods on the NCBI PPI...
- figshare.com
xlsUpdated May 30, 2023ShareFacebookTwitterEmailClick to copy linkLink copiedCiteJoana P. Gonçalves; Alexandre P. Francisco; Yves Moreau; Sara C. Madeira (2023). Leave-one-out cross-validation results of all methods on the NCBI PPI network. [Dataset]. http://doi.org/10.1371/journal.pone.0049634.t003xlsAvailable download formatsUnique identifierhttps://doi.org/10.1371/journal.pone.0049634.t003Dataset updatedMay 30, 2023Dataset provided byPLOS ONEAuthorsJoana P. Gonçalves; Alexandre P. Francisco; Yves Moreau; Sara C. MadeiraLicenseAttribution 4.0 (CC BY 4.0)https://creativecommons.org/licenses/by/4.0/
License information was derived automaticallyDescriptionResults of each tested prioritization method on the NCBI PPI network. Mean and standard deviation of four evaluation measures (AUC, MAP, and percentage of left-out genes ranked in tops 10 and 20), obtained for 10 complete leave-one-out cross-validations on the 29 disease sets using 10 distinct previously generated candidate sets. ‘SRec’: percentage of left-out genes (from the total number of seeds in the original seed sets: 620) effectively ranked, that is, yielding a ranking score larger than zero. ‘DRec’: percentage of recovered diseases among the 29 diseases with seeds (a disease is recovered if at least one of its left-out genes obtained a ranking score larger than zero). ‘SEval’: percentage of left-out genes (from the total number of seeds originally in the seed sets: 620) in the network. All evaluation measures, AUC, MAP, TOP 10 and TOP 20, were computed taking into account only the left-out genes present in each network (SEval), rather than all the genes originally in the seed sets. Parameters: HDiffusion (, ), PRank (, ).
- t
Pressure drop data of two-phase flow in a horizontal tube filled with metal...
- service.tib.eu
Updated Aug 4, 2023+ more versionsShareFacebookTwitterEmailClick to copy linkLink copiedCite(2023). Pressure drop data of two-phase flow in a horizontal tube filled with metal sponge - Vdataset - LDM [Dataset]. https://service.tib.eu/ldmservice/dataset/rdr-doi-10-35097-1126Dataset updatedAug 4, 2023LicenseAttribution-ShareAlike 4.0 (CC BY-SA 4.0)https://creativecommons.org/licenses/by-sa/4.0/
License information was derived automaticallyDescriptionAbstract: Experimentelle Daten zur Zweiphasenströmung von gesättigtem CO2 in einem horizontalen zylindrischen Rohr (Durchmesser 14 mm) mit integrierten Metallschwämmen (offenzellige Metallschäume) unter adiabaten sowie diabaten Bedingungen werden vorgestellt. Außerdem wurde der Druckverlust bei einphasiger Durchströmung derselben Schwämme untersucht. Die nominelle Zelldichte der Schwämme beträgt 10 ppi („Poren pro Zoll“) bzw. 20 ppi. Der Massen-strom wurde von 25 kg/(m²s) bis 150 kg/(m²s) variiert und im Falle einer Zweiphasen¬strömung ebenfalls der Strömungsdampfgehalt (von 0,1 bis 1). Der Sättigungsdruck betrug entweder 12 bar oder 26,5 bar. Die mit Schwämmen gefüllte Länge stromaufwärts der Messstrecke variierte zwischen 12 mm und 210 mm bei 10 ppi Schwämmen und betrug 109 mm bei 20 ppi Schwämmen. Zusätzlich wurden die für den Druckverlust relevanten geometrische Eigenschaften der Schwämme, nämlich der Fensterdurchmesser, der Steg¬durchmesser, die Porosität und die spezifische Oberfläche, bestimmt. Abstract: Experimental data on the adiabatic and diabatic two-phase flow of saturated CO2 in a horizontal cylindrical tube (diameter 14 mm) with integrated metal sponges (open-cell metal foams) are presented. Moreover, the pressure drop of single-phase flow inside the same metal sponges was investigated. The nominal cell density of the sponges is 10 ppi (“pores per inch”) or 20 ppi. The mass flow was varied from 25 kg/(m²s) to 150 kg/(m²s) and the flow vapor quality from 0.1 to 1 in case of two-phase flow. The saturation pressure was either 12 bar or 26.5 bar. The length filled with sponges upstream of the test section varied from 12 mm to 210 mm for 10 ppi sponges and was 109 mm for 20 ppi sponges. In addition, geometric properties of the sponges relevant to pressure loss, such as window diameter, strut diameter, porosity and specific surface area, were determined. TechnicalRemarks: Sponges 10 ppi copper sponge (total length 200 mm, diameter 14 mm) made by replication technique total porosity: 91% open porosity: between 85% and 88% nominal cell density: approximately 10 pores per inch mean strut diameter: 0.45 mm * mean window diameter: 1.6 mm 10 ppi plastic sponge (total length 47 mm, diameter 14 mm) made by 3D printing total and open porosity: 86% nominal cell density: approximately 10 pores per inch mean strut diameter: 0.6 mm mean window diameter: 2.0 mm 20 ppi copper sponge (total length 247 mm, diameter 14 mm) made by replication technique total porosity: 90% open porosity: between 84% and 87% nominal cell size: approximately 20 pores per inch mean strut diameter: 0.28 mm
- t
BIOGRID CURATED DATA FOR PUBLICATION: Relative potency of proton-pump...
- thebiogrid.org
zipUpdated Oct 20, 2008ShareFacebookTwitterEmailClick to copy linkLink copiedCiteBioGRID Project (2008). BIOGRID CURATED DATA FOR PUBLICATION: Relative potency of proton-pump inhibitors-comparison of effects on intragastric pH. [Dataset]. https://thebiogrid.org/175337/publication/relative-potency-of-proton-pump-inhibitors-comparison-of-effects-on-intragastric-ph.htmlzipAvailable download formatsDataset updatedOct 20, 2008Dataset authored and provided byBioGRID ProjectLicenseMIT Licensehttps://opensource.org/licenses/MIT
License information was derived automaticallyDescriptionProtein-Protein, Genetic, and Chemical Interactions for Kirchheiner J (2009):Relative potency of proton-pump inhibitors-comparison of effects on intragastric pH. curated by BioGRID (https://thebiogrid.org); ABSTRACT: Comparative potency of proton-pump inhibitors (PPIs) is an important clinical issue. Most available trials have compared the different PPIs at one or a few selected specific dosages, making it difficult to derive quantitative equivalence dosages. Here we derived PPI dose equivalents based on a comprehensive assessment of dose-dependent effects on intragastric pH.All available clinical studies reporting the effects of PPIs on mean 24-h intragastric pH were sought from electronic databases including Medline. Studies included were restricted to those targeting the Caucasian population, and healthy volunteers or gastroesophageal reflux disease (GERD) patients. The dose-effect relationships for mean 24-h intragastric pH and for percentage of time with pH > 4 in 24 h were analyzed for each PPI using pharmacodynamic modeling with NONMEM and a model integrating all available data.Fifty-seven studies fulfilled the inclusion criteria. Based on the mean 24-h gastric pH, the relative potencies of the five PPIs compared to omeprazole were 0.23, 0.90, 1.00, 1.60, and 1.82 for pantoprazole, lansoprazole, omeprazole, esomeprazole, and rabeprazole, respectively. Compared with healthy volunteers, patients with GERD needed a 1.9-fold higher dose and Helicobacter pylori-positive individuals needed only about 20% of the dose to achieve a given increase in mean 24-h intragastric pH.The present meta-analysis provides quantitative estimates on clinical potency of individual PPIs that may be helpful when switching between PPIs and for assessing the cost-effectiveness of specific PPIs. However, our estimates must be viewed with caution because only a limited dose range has been tested and not exactly the same study conditions were applied for the different substances.
Summary of DSD improvements of all four methods in 2-fold cross validation...
- plos.figshare.com
xlsUpdated Jun 3, 2023ShareFacebookTwitterEmailClick to copy linkLink copiedCiteMengfei Cao; Hao Zhang; Jisoo Park; Noah M. Daniels; Mark E. Crovella; Lenore J. Cowen; Benjamin Hescott (2023). Summary of DSD improvements of all four methods in 2-fold cross validation (mean and standard deviation in percentage) for the PPI network of S. cerevisiae. [Dataset]. http://doi.org/10.1371/journal.pone.0076339.t001xlsAvailable download formatsUnique identifierhttps://doi.org/10.1371/journal.pone.0076339.t001Dataset updatedJun 3, 2023AuthorsMengfei Cao; Hao Zhang; Jisoo Park; Noah M. Daniels; Mark E. Crovella; Lenore J. Cowen; Benjamin HescottLicenseAttribution 4.0 (CC BY 4.0)https://creativecommons.org/licenses/by/4.0/
License information was derived automaticallyDescriptionSummary of DSD improvements of all four methods in 2-fold cross validation (mean and standard deviation in percentage) for the PPI network of S. cerevisiae.
- m
Supplemental Methods Final PPI Fungal
- data.mendeley.com
Updated Mar 25, 2025ShareFacebookTwitterEmailClick to copy linkLink copiedCiteRahib Islam (2025). Supplemental Methods Final PPI Fungal [Dataset]. http://doi.org/10.17632/h5y9wktcrz.1Unique identifierhttps://doi.org/10.17632/h5y9wktcrz.1Dataset updatedMar 25, 2025AuthorsRahib IslamLicenseAttribution 4.0 (CC BY 4.0)https://creativecommons.org/licenses/by/4.0/
License information was derived automaticallyDescriptionA retrospective cohort study was conducted using the TriNetX Global Collaborative Network, a federated database comprising de-identified electronic health records from 142 healthcare organizations (HCOs). The database was queried on March 13, 2025, to identify patients diagnosed with gastroesophageal reflux disease (GERD). Patients were stratified into two cohorts based on proton pump inhibitor (PPI) exposure. The GERD+PPI cohort included patients with a diagnosis of GERD (ICD-10: K21) who had ≥2 prescriptions for a PPI (omeprazole, esomeprazole, pantoprazole, lansoprazole, dexlansoprazole, or rabeprazole) within 5 years prior to the index date. The GERD control cohort included GERD patients with no history of PPI use, defined as no recorded prescriptions for any listed PPIs at any time. Patients were excluded in the risk analysis if they had a history of cutaneous fungal infections, including onychomycosis, tinea corporis, tinea pedis, tinea cruris, or cutaneous candidiasis. Additional exclusions included a history of systemic antifungal use (fluconazole, terbinafine, itraconazole) within 1 day prior to the index date or a history of immunodeficiency conditions, including HIV (ICD-10: B20), solid organ transplantation, or primary immunodeficiency disorders (ICD-10: D80-D84). Cohorts were propensity score-matched (1:1) to minimize confounding, using variables including age, sex, race/ethnicity, diabetes, obesity, immunosuppression, and concurrent medication use. Standardized mean differences (SMDs) were used to assess balance between matched cohorts. The primary outcome was the incidence of cutaneous fungal infections following PPI use. Risk ratios (RR) with 95% confidence intervals (CIs) were calculated using logistic regression. A p-value <0.05 was considered statistically significant. All statistical analyses were conducted within the TriNetX platform.
- f
Mean fitnesses of the population as estimated by FitSeq.
- plos.figshare.com
csvUpdated Jan 17, 2025ShareFacebookTwitterEmailClick to copy linkLink copiedCiteDarach Miller; Adam Dziulko; Sasha Levy (2025). Mean fitnesses of the population as estimated by FitSeq. [Dataset]. http://doi.org/10.1371/journal.pone.0299440.s034csvAvailable download formatsUnique identifierhttps://doi.org/10.1371/journal.pone.0299440.s034Dataset updatedJan 17, 2025Dataset provided byPLOS ONEAuthorsDarach Miller; Adam Dziulko; Sasha LevyLicenseAttribution 4.0 (CC BY 4.0)https://creativecommons.org/licenses/by/4.0/
License information was derived automaticallyDescriptionMean fitnesses of the population as estimated by FitSeq.
FacebookTwitterAttribution 3.0 (CC BY 3.0)https://creativecommons.org/licenses/by/3.0/
License information was derived automatically
Contains a range of producer price indexes. Firstly, economy-wide indexes are presented within a Stage of Production (SOP) framework, followed by a set of partial, stand-alone measures relating to specific industry sectors of the economy (selected manufacturing, construction, mining and service industries).