- E
Simple maps for Schools
- dtechtive.com
- find.data.gov.scot
xml, zipUpdated Feb 22, 2017 Share
Share Facebook
 Twitter
 EmailClick to copy linkLink copiedCiteUniversity of Edinburgh (2017). Simple maps for Schools [Dataset]. http://doi.org/10.7488/ds/1914zip(5.35 MB), xml(0.0039 MB)Available download formatsUnique identifierhttps://doi.org/10.7488/ds/1914Dataset updatedFeb 22, 2017Dataset provided byUniversity of EdinburghLicense
ODC Public Domain Dedication and Licence (PDDL) v1.0http://www.opendatacommons.org/licenses/pddl/1.0/
License information was derived automaticallyDescriptionThis is a collection of simple maps in PDF format that are designed to be printed off and used in the classroom. The include maps of Great Britain that show the location of major rivers, cities and mountains as well as maps of continents and the World. There is very little information on the maps to allow teachers to download them and add their own content to fit with their lesson plans. Customise one print out then photocopy them for your lesson. data not available yet, holding data set (7th August). Other. This dataset was first accessioned in the EDINA ShareGeo Open repository on 2012-08-07 and migrated to Edinburgh DataShare on 2017-02-22.
- s
Counties and Unitary Authorities (April 2023) Map in the UK
- geoportal.statistics.gov.uk
- hub.arcgis.com
Updated May 31, 2023+ more versionsShareFacebookTwitterEmailClick to copy linkLink copiedCiteOffice for National Statistics (2023). Counties and Unitary Authorities (April 2023) Map in the UK [Dataset]. https://geoportal.statistics.gov.uk/documents/1aa806eb35ee4334a87f5970c82e3ac0Dataset updatedMay 31, 2023Dataset authored and provided byOffice for National StatisticsLicensehttps://www.ons.gov.uk/methodology/geography/licenceshttps://www.ons.gov.uk/methodology/geography/licences
Area coveredDescriptionA PDF map that shows the counties and unitary authorities in the United Kingdom as at 1 April 2023. (File Size - 583 KB)
- s
Excel Mapping Template for London Boroughs and Wards
- ckan.publishing.service.gov.uk
- data.europa.eu
Updated Oct 28, 2025+ more versionsShareFacebookTwitterEmailClick to copy linkLink copiedCite(2025). Excel Mapping Template for London Boroughs and Wards [Dataset]. https://ckan.publishing.service.gov.uk/dataset/excel-mapping-template-for-london-boroughs-and-wardsDataset updatedOct 28, 2025Area coveredLondonDescriptionA free mapping tool that allows you to create a thematic map of London without any specialist GIS skills or software - all you need is Microsoft Excel. Templates are available for London’s Boroughs and Wards. Full instructions are contained within the spreadsheets. Macros The tool works in any version of Excel. But the user MUST ENABLE MACROS, for the features to work. There a some restrictions on functionality in the ward maps in Excel 2003 and earlier - full instructions are included in the spreadsheet. To check whether the macros are enabled in Excel 2003 click Tools, Macro, Security and change the setting to Medium. Then you have to re-start Excel for the changes to take effect. When Excel starts up a prompt will ask if you want to enable macros - click yes. In Excel 2007 and later, it should be set by default to the correct setting, but if it has been changed, click on the Windows Office button in the top corner, then Excel options (at the bottom), Trust Centre, Trust Centre Settings, and make sure it is set to 'Disable all macros with notification'. Then when you open the spreadsheet, a prompt labelled 'Options' will appear at the top for you to enable macros. To create your own thematic borough maps in Excel using the ward map tool as a starting point, read these instructions. You will need to be a confident Excel user, and have access to your boundaries as a picture file from elsewhere. The mapping tools created here are all fully open access with no passwords. Copyright notice: If you publish these maps, a copyright notice must be included within the report saying: "Contains Ordnance Survey data © Crown copyright and database rights." NOTE: Excel 2003 users must 'ungroup' the map for it to work.
Aquifer Vulnerability Maps England and Wales
- data.europa.eu
- metadata.bgs.ac.uk
- +2more
unknownUpdated Sep 25, 2021+ more versionsShareFacebookTwitterEmailClick to copy linkLink copiedCiteBritish Geological Survey (BGS) (2021). Aquifer Vulnerability Maps England and Wales [Dataset]. https://data.europa.eu/data/datasets/aquifer-vulnerability-maps-england-and-walesunknownAvailable download formatsDataset updatedSep 25, 2021AuthorsBritish Geological Survey (BGS)Area coveredWales, EnglandDescriptionDigitised versions of a set of 1:100,000 scale maps of aquifer vulnerability for England and Wales. The dataset identifies the vulnerability to pollution of major and minor aquifers as defined by the Environment Agency, utilising a combination of geological, hydrogeological and soils data. The maps are designed to be used by planners, developers, consultants and regulatory bodies to ensure that developments conform to the Policy and Practice of the Environment Agency for the protection of Groundwater. Please note that these maps are based on data from the late 1980's and early 1990's, more up-to-date digital data may now be available from the Environment Agency. Flat maps may be purchased from the BGS, some sheets are now out of print.
Tree Trails - Abbey Park - Dataset - data.gov.uk
- ckan.publishing.service.gov.uk
Updated Feb 8, 2023+ more versionsShareFacebookTwitterEmailClick to copy linkLink copiedCiteckan.publishing.service.gov.uk (2023). Tree Trails - Abbey Park - Dataset - data.gov.uk [Dataset]. https://ckan.publishing.service.gov.uk/dataset/tree-trails-abbey-parkDataset updatedFeb 8, 2023DescriptionThe Abbey Park tree trail allows visitors to have a leisurely walk and find out interesting facts about many of the magnificent trees that reside within the park.The 21 trees are all marked with small round numbered metal tags.This dataset contains a table of tree details, images of the trees and maps and is best used with a mobile device where location services can be used to follow the tree trail. For users who wish to print out a map of the locations of the trees it is suggested to use the "Categorised Map" tab within the dataset for this purpose by using the snipping tool on a full screen view of the map. To download the table of data regarding the trees use the export "Export" tab to download the data into a printable spreadsheet format by using the Excel format option. Data and Resources csvhttps://www.iana.org/assignments/media-types/text/csv Tree Trails - Abbey Park (csv)
Sub-regional Feed-in Tariffs statistics
- gov.uk
Updated Jan 30, 2020+ more versionsShareFacebookTwitterEmailClick to copy linkLink copiedCiteDepartment for Energy Security and Net Zero (2020). Sub-regional Feed-in Tariffs statistics [Dataset]. https://www.gov.uk/government/statistical-data-sets/sub-regional-feed-in-tariffs-confirmed-on-the-cfr-statisticsDataset updatedJan 30, 2020AuthorsDepartment for Energy Security and Net ZeroDescriptionQuarterly sub-regional statistics show the number of installations and total installed capacity by technology type in England, Scotland and Wales at the end the latest quarter that have been confirmed on the Central Feed-in Tariff Register.
Following the closure of the Feed-in-Tariff scheme in March 2019, the release published in January 2020 will be the final release of this publication.
Contact
For general enquiries concerning the table and maps email fitstatistics@energysecurity.gov.uk
https://assets.publishing.service.gov.uk/media/5e318b28ed915d091ad1ca19/December_2019_Sub-regional_Feed-in_Tariffs_confirmed_CFR.xls">Sub-regional Feed-in Tariffs confirmed on the CFR statistics
Request an accessible format.<p class="gem-c-attachment_metadata"><span class="gem-c-attachment_attribute">MS Excel Spreadsheet</span>, <span class="gem-c-attachment_attribute">944 KB</span></p> <p class="gem-c-attachment_metadata">This file may not be suitable for users of assistive technology.</p> <details data-module="ga4-event-tracker" data-ga4-event='{"event_name":"select_content","type":"detail","text":"Request an accessible format.","section":"Request an accessible format.","index_section":1}' class="gem-c-details govuk-details govuk-!-margin-bottom-0" title="Request an accessible format.">If you use assistive technology (such as a screen reader) and need a version of this document in a more accessible format, please email <a href="mailto:alt.formats@energysecurity.gov.uk" target="_blank" class="govuk-link">alt.formats@energysecurity.gov.uk</a>. Please tell us what format you need. It will help us if you say what assistive technology you use.<a class="govuk-link" target="_self" data-ga4-link='{"event_name":"file_downlo
- n
NRSC Landsat TM Imagery
- access.earthdata.nasa.gov
- cmr.earthdata.nasa.gov
Updated Apr 21, 2017ShareFacebookTwitterEmailClick to copy linkLink copiedCite(2017). NRSC Landsat TM Imagery [Dataset]. https://access.earthdata.nasa.gov/collections/C1214607952-SCIOPSDataset updatedApr 21, 2017Time period coveredJul 16, 1982 - PresentArea coveredDescriptionLandsat TM data has been available since launch of Landsat 4 on 17 July 1982 and Landsat 5 on 1 March 1984. The National Remote Sensing Centre (NRSC) acquired this data from the ESA receiving stations to build up its archive of good quality scenes of the UK. The archive also contains scenes from various countries around the world. The TM data is available in 7 bands. The resolution is 30m for the visible, near and middle infrared bands and 120m for the thermal infrared. The repeat cycle is 16 days.
The products available from the NRSC are: i) B/W print or film of a single band full or 1/4 scene or extract ii) TM colour composite print or film of a full scene, 1/4 scene or extract iii) Digital versions of scenes on CCT, Exabyte or CD-ROM Price lists of these products are available on request to the National Remote Sensing Centre (NRSC). - l
Evington Park Tree Trail
- data.leicester.gov.uk
csv, excel, geojson +1Updated Oct 5, 2023ShareFacebookTwitterEmailClick to copy linkLink copiedCite(2023). Evington Park Tree Trail [Dataset]. https://data.leicester.gov.uk/explore/dataset/evington-park-tree-trail/geojson, excel, csv, jsonAvailable download formatsDataset updatedOct 5, 2023LicenseOpen Government Licence 3.0http://www.nationalarchives.gov.uk/doc/open-government-licence/version/3/
License information was derived automaticallyArea coveredEvingtonDescriptionThe Evington Park tree trail allows visitors to have a leisurely walk and find out interesting facts about many of the magnificent trees that reside within the park.The 21 trees are all marked with small round numbered metal tags.This dataset contains a table of tree details, images of the trees and maps and is best used with a mobile device where location services can be used to follow the tree trail.For users who wish to print out a map of the locations of the trees it is suggested to use the "Categorised Map" tab within the dataset for this purpose by using the snipping tool on a full screen view of the map.To download the table of data regarding the trees use the export "Export" tab to download the data into a printable spreadsheet format by using the Excel format option.
- n
NRSC SPOT Data
- access.earthdata.nasa.gov
- cmr.earthdata.nasa.gov
Updated Apr 21, 2017ShareFacebookTwitterEmailClick to copy linkLink copiedCite(2017). NRSC SPOT Data [Dataset]. https://access.earthdata.nasa.gov/collections/C1214607962-SCIOPSDataset updatedApr 21, 2017Time period coveredFeb 22, 1986 - PresentArea coveredDescriptionSPOT data has been available from 22 February 1986 and the UK National Remote Sensing Centre (NRSC) is the official distributor of SPOT data in the UK and concentrates on the acquisition and archiving of UK data, although the archive contains a growing number of scenes of other countries. The SPOT data is available in 3 multispectral bands (0.5-0.59, 0.61-0.68, 0.79-0.89) and panchromatic band. The resolution is 20m for the multispectral mode and 10m in panchromatic mosaic. The repeat cycle is 26 days.
    SPOT also offers a revisit capability and the possibility of stereographic
    imagery. SPOT digital products available from the NRSC are single scene on
    6250 bpi tape or four 1600 bpi tapes. The CCT's are available as either
    band interleaved or band sequential and ASCII or EBCDIC coding. The data is
    also available on Exabyte and CD-ROM. The photographic products are either
    on film (240mm) or paper print (various sizes up to 960mm). Price lists
    of these products are available on request to the National Remote Sensing
    Centre (NRSC).
Tree Trails - Castle Hill Country Park - Dataset - data.gov.uk
- ckan.publishing.service.gov.uk
Updated Apr 6, 2023+ more versionsShareFacebookTwitterEmailClick to copy linkLink copiedCiteckan.publishing.service.gov.uk (2023). Tree Trails - Castle Hill Country Park - Dataset - data.gov.uk [Dataset]. https://ckan.publishing.service.gov.uk/dataset/tree-trails-castle-hill-country-parkDataset updatedApr 6, 2023DescriptionThe Castle Hill Country Park tree trail allows visitors to have a leisurely walk and find out interesting facts about many of the magnificent trees that reside within the park.The 17 trees are all marked with small round numbered metal tags.This dataset contains a table of tree details, images of the trees and maps. For users who wish to print out a map of the locations of the trees it is suggested to use the "Categorised Map" tab within the dataset for this purpose, accompanied by the table which can be downloaded via the "Export" tab.
- N
Meta-analysis of regional white matter volume in bipolar disorder with...
- neurovault.org
niftiUpdated Jun 30, 2018+ more versionsShareFacebookTwitterEmailClick to copy linkLink copiedCite(2018). Meta-analysis of regional white matter volume in bipolar disorder with replication in an independent sample using coordinates, T-maps, and individual MRI data: Independent study for replication Gray matter (contrast is Control > Patients not taking lithium so positives values are reduction in volume in patients) [Dataset]. http://identifiers.org/neurovault.image:61002niftiAvailable download formatsUnique identifierhttps://identifiers.org/neurovault.image:61002Dataset updatedJun 30, 2018LicenseCC0 1.0 Universal Public Domain Dedicationhttps://creativecommons.org/publicdomain/zero/1.0/
License information was derived automaticallyDescriptionFrom paper:
Subjects
The VBM analysis included 26 euthymic patients with BD (23 with bipolar I and 3 with bipolar II, 9 males and 17 females) and 23 healthy control subjects (7 males and 16 females). The patients were primarily recruited from a UK patient support group, healthy controls were recruited via advertisements in local media. The study was approved by the local ethics committee and written informed consent was obtained from all participants. All subjects were assessed using the Structural Clinical Interview for DSM-IV Axis I Disorders (SCID-CV). Patients were included if they fulfilled criteria for DSM-IV for BD and did not have any comorbidity for other DSM-IV Axis-I disorders. Healthy controls subjects were selected in order to match BD patients for age, sex, race/ethnicity, weight, height, handedness, premorbid IQ, years of education, lifetime drug and alcohol use. They were included if they had no DSM-IV Axis I disorders and no family history of psychiatric conditions. The mean age was 42.1 (± SD 14.8) for BD patients and 41.2 (± SD 14.0) for healthy controls. Demographic and clinical measures are given in table s1 and s2.MRI acquisition
Participants were scanned using a 1.5 Tesla Siemens Magnetom Vision MRI scanner to obtain T1 weighted MPRAGE (Multi-Planar Rapidly Acquired Gradient Echo) scans. In order to confer good resolution and good contrast between grey and white matter in particular, the following parameters were selected: TR = 9.7 ms, TE = 4 ms, TI = 300 ms, Nex = 1, 256 x 192 matrix, flip angle = 8°, 128 slices, voxel size = 1.0 x 1.0 x 2.0mm. There was no significant difference in scan date between patients and controls (p=0.28).VBM DARTEL pre-processing
We examined group-related differences in regional brain volume using voxel-based morphometry, as implemented in SPM8 software (http://www.fil.ion.ucl.ac.uk/spm/) running under MATLAB R2012b, version 8.0 (The MathWorks, Icn, Natick, Massachussetts). First the T1-weighted images were pre-processed using the DARTEL (Diffeomorphic Anatomical Registration using Exponentiated Lie algebra) algorithm (Ashburner, 2007) following the steps described by Ashburner (Ashburner, 2010). Firstly, each T1-weighted image was checked for scanner artefacts and gross anatomical abnormalities and then manually reoriented to the Anterior Commissure-Posterior Commissure line blind to diagnosis. The images were then segmented into grey matter, white matter and cerebrospinal fluid in native space. The DARTEL SPM8 toolbox was used to implement the high-dimensional DARTEL normalization through which the DARTEL template was created from the images of all the subjects of the study. During the template creation, flow fields were computed which contain information about the transformation from every native image to the DARTEL template (Peelle et al., 2012). This procedure increases the accuracy of the alignment between subjects by using millions of parameters to characterise the spatial transformations of each brain (Ashburner, 2010). In order to allow for inter-study comparisons, the segmented images were spatially normalized to MNI space including the flow fields in the process. The images were ‘modulated’ to conserve the information on absolute volume. Smoothing was applied to the images using a FWHM 8mm isotropic Gaussian kernel resulting in smoothed, segmented, normalized, and modulated images.VBM Statistical analysis
A central aim of the study was to examine the volume of the white matter ROI created by the meta-analysis in an independent sample, however for completeness in the supplementary materials we present the whole VBM brain analysis of the independent dataset. Total intracranial volume was determined for each subject by summing grey matter, white matter and CSF segmentations. The regional differences in voxel-based parameters between BD and controls were assessed using a General Linear Model (GLM) with total intracranial volume and age as covariates of no interest. An absolute threshold masking of 0.05 was adopted in order to exclude voxels outside the brain. A height threshold of p < 0.05 FWE (family wise error) corrected was initially adopted to detect significant regional differences. In addition a more liberal height threshold of p < 0.001, uncorrected for multiple comparisons, was also applied with a cluster threshold of 10 voxels. Following this height threshold, a non-stationary cluster extend correction was implemented at the cluster threshold of p < 0.05 family-wise error (FWE) corrected for multiple comparisons in order to account for the non-isotropic (non-uniform) smoothness across the data (Hayasaka et al., 2004; Worsley et al., 1999). This correction was performed using the VBM8 toolbox (available online at http://dbm.neuro.uni-jena.de/vbm/download). Finally we implemented the same method excluding patients who were taking lithium as studies have demonstrated that lithium may increase total grey matter volume (Hallahan et al., 2011; Kempton et al., 2008; Monkul et al., 2007; Moore et al., 2009; Sassi et al., 2002). Montreal Neurological Institute (MNI) coordinates are reported in the results tables (supplementary table 3 and table 4), however these coordinates were converted to Talairach coordinates to determine the names of corresponding brain regions. MNI coordinates were converted to Talairach using GingerALE, version 2.1.1 (available online at http://www.brainmap.org/ale/) and brain region names were determined using Talairach Client, version 2.4.3 (available online at http://www.talairach.org/client.html).Supplementary Results
Independent VBM whole brain study results
No significant differences in white or gray matter volume were found at the height threshold of p < 0.05 FWE corrected. The analysis was then repeated with a height threshold of p < 0.001 uncorrected. Regions of significant white matter volume decreases at a height threshold of p<0.001 uncorrected are shown in supplementary table 3. No regions of significant increased white matter in bipolar patients compared to controls were found. Two clusters of voxels survived the additional non-stationary cluster extent threshold of p < 0.05 FWE corrected for multiple comparisons in the white matter results. These clusters encompassed white matter adjacent to the cingulate gyrus and in the corpus callosum (supplementary figure 3). Grey matter volume differences between the two groups are also shown in supplementary table 3. Finally, we found regions of decreased and increased grey matter in bipolar patients that were not taking lithium compared to healthy controls (supplementary table 4). The T-maps of each contrast are freely available to download from www.bipolardatabase.org. The white matter results have been used in the main paper to validate the region of interest found in our meta-analysis.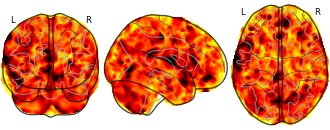
Collection description
Converging evidence suggests that bipolar disorder (BD) is associated with white matter (WM) abnormalities.
Meta-analyses of voxel based morphometry (VBM) data is commonly performed using published coordinates,
however this method is limited since it ignores non-significant data. Obtaining statistical maps from studies (Tmaps)
as well as raw MRI datasets increases accuracy and allows for a comprehensive analysis of clinical
variables. We obtained coordinate data (7-studies), T-Maps (12-studies, including unpublished data) and raw
MRI datasets (5-studies) and analysed the 24 studies using Seed-based d Mapping (SDM). A VBM analysis was
conducted to verify the results in an independent sample. The meta-analysis revealed decreased WM volume in
the posterior corpus callosum extending to WM in the posterior cingulate cortex. This region was significantly
reduced in volume in BD patients in the independent dataset (p = 0.003) but there was no association with
clinical variables. We identified a robust WM volume abnormality in BD patients that may represent a trait
marker of the disease and used a novel methodology to validate the findingsSubject species
homo sapiens
Modality
Structural MRI
Analysis level
group
Cognitive paradigm (task)
Young Mania Rating Scale
Map type
T
Book Publishing in the UK - Market Research Report (2015-2030)
- ibisworld.com
ShareFacebookTwitterEmailClick to copy linkLink copiedCiteIBISWorld, Book Publishing in the UK - Market Research Report (2015-2030) [Dataset]. https://www.ibisworld.com/united-kingdom/industry/book-publishing/3460Dataset authored and provided byIBISWorldLicensehttps://www.ibisworld.com/about/termsofuse/https://www.ibisworld.com/about/termsofuse/
Time period covered2014 - 2029Area coveredUnited KingdomDescriptionThe UK is home to some of the world's oldest and most esteemed book publishers. Cambridge University Press is the world's oldest publishing house (operating since 1584). The UK is the largest exporter of books in the world, owing to the global ubiquity of the English language, the reputation of the UK industry and the strength of local copyright law. Economic headwinds have damaged the UK book publishing industry with revenue anticipated to stall over the five years through 2024-25, standing at £6.9 billion. Book publishers’ revenue and profit took a sharp dive in 2020-21 because of supply chain hiccups with paper and ink production and a drop in distribution capacity, a fallout from COVID-19. More recently, publishers have faced climbing costs thanks to rampant inflation, which hit both the paper and digital segments of the market. At the same time, consumers have reined in leisure spending, limiting their book purchases. Fast forward to 2024-25, however and inflation is starting to ease, alleviating cost pressures. Profit is slated to continue its uphill climb, albeit still falling short of its pre-pandemic level. Both print sales and export trade are edging upwards. Printed books fetch more at retail, although e-books often net a heftier profit as a result of lower overheads. Plus, the digital and AI revolution is broadening export scope. In 2024-25, revenue is anticipated to jump by 4.3%. As e-book technology and digital publishing continue to mature, many publishing houses have successfully modified their strategies to adjust to the growing trend for digitalisation. The self-published market will continue to expand and more publishing houses are set to take advantage of this. A number of UK-based book publishers will consolidate in order to bolster their position in relation to retailers, which is expected to support revenue. Revenue is forecast to swell at a compound annual rate of 2.5% over the five years through 2029-30 to reach £7.8 billion.
- n
NRSC Landsat MSS imagery
- access.earthdata.nasa.gov
- cmr.earthdata.nasa.gov
Updated Apr 21, 2017ShareFacebookTwitterEmailClick to copy linkLink copiedCite(2017). NRSC Landsat MSS imagery [Dataset]. https://access.earthdata.nasa.gov/collections/C1214607914-SCIOPSDataset updatedApr 21, 2017Time period coveredJul 23, 1972 - PresentArea coveredDescriptionLandsat MSS data has been available from 23rd of July 1972 and the National Remote Sensing Centre (NRSC) acquired this data from the ESA receiving stations to build up its archive of good quality scenes of the UK. The archive also contains many scenes from various countries of the world. The MSS data is available in 4 bands (0.6-0.6, 0.6-0.7, 0.7-0.8, 0.8-1.1). Landsat 1/2/3 had an 18 day repeat cycle and Landsat 4/5 have a 16 day repeat cycle. The resolution is 80m.
The products available from the NRSC are digital or photographic. The digital products are: i) MSS raw data ii) MSS absolute radiometric correction iii) MSS statistical radiometric correction iv) MSS absolute and statistical radiometric correction The photographic products are: i) B/W print of a single band of an MSS scene ii) MSS colour composite of a given scene Price lists of these products are available on request from the National Remote Sensing Centre (NRSC). - d
Sustainable Farming Incentive Moorland Standard Survey Planning Grid
- environment.data.gov.uk
Updated Sep 1, 2022+ more versionsShareFacebookTwitterEmailClick to copy linkLink copiedCiteNatural England (2022). Sustainable Farming Incentive Moorland Standard Survey Planning Grid [Dataset]. https://environment.data.gov.uk/dataset/0f3c73b6-875f-4be6-8b92-c423adeb650dDataset updatedSep 1, 2022LicenseOpen Government Licence 3.0http://www.nationalarchives.gov.uk/doc/open-government-licence/version/3/
License information was derived automaticallyDescriptionThe grid layer will support farmers who have entered land in the Introductory level of the Sustainable Farming Incentive (SFI) Moorland Standard. The standard requires that agreement holders carry out a survey of their moorland, with observations within each 10 hectare block. The moorland grid map available through Magic will allow farmers to print a base map and plan their moorland survey to meet the requirements of the standard.
- n
M.E. Jarvis et al. 2019: Radio Images, IFU cube and [O III] maps for...
- data.ncl.ac.uk
binUpdated Jun 1, 2023+ more versionsShareFacebookTwitterEmailClick to copy linkLink copiedCiteChristopher Harrison (2023). M.E. Jarvis et al. 2019: Radio Images, IFU cube and [O III] maps for J1338+1503 [Dataset]. http://doi.org/10.25405/data.ncl.13242191.v1binAvailable download formatsUnique identifierhttps://doi.org/10.25405/data.ncl.13242191.v1Dataset updatedJun 1, 2023Dataset provided byNewcastle UniversityAuthorsChristopher HarrisonLicenseAttribution 4.0 (CC BY 4.0)https://creativecommons.org/licenses/by/4.0/
License information was derived automaticallyDescriptionThis relates to: M.E. Jarvis et al. 2019, MNRAS, 485, 2710, "Prevalence of radio jets associated with galactic outflows and feedback from quasars". Available on the pre-print archive: arxiv.org/abs/1902.07727This contains:- The Low Resolution ("LR") image from the Very Large Array (VLA) (see Table 3 and Section 3.1)- The IFU data cube used (see Section 3.3)- One file containing the four [O III] maps as four separate fits extensions (SNR, v50, W80 and A; see Section 4.2). Note the units for the v50 and W80 maps is angstroms.The details of how the images, data cubes and maps were produced are in the paper. The data files also contain extensive meta-data in the header following the standard for astronomical images.
MSOA Atlas - Dataset - data.gov.uk
- ckan.publishing.service.gov.uk
Updated Mar 23, 2017+ more versionsShareFacebookTwitterEmailClick to copy linkLink copiedCiteckan.publishing.service.gov.uk (2017). MSOA Atlas - Dataset - data.gov.uk [Dataset]. https://ckan.publishing.service.gov.uk/dataset/msoa-atlasDataset updatedMar 23, 2017DescriptionThis MSOA atlas provides a summary of demographic and related data for each Middle Super Output Area in Greater London. The average population of an MSOA in London in 2010 was 8,346, compared with 1,722 for an LSOA and 13,078 for a ward. The profiles are designed to provide an overview of the population in these small areas by combining a range of data on the population, births, deaths, health, housing, crime, commercial property/floorspace, income, poverty, benefits, land use, environment, deprivation, schools, and employment. If you need to find an MSOA and you know the postcode of the area, the ONS NESS search page has a tool for this. The MSOA Atlas is available as an XLS as well as being presented using InstantAtlas mapping software. This is a useful tool for displaying a large amount of data for numerous geographies, in one place (requires HTML 5). NB. It is currently not possible to export the map as a picture due to a software issue with the Google Maps background. We advise you to print screen to copy an image to the clipboard. Tips: Select a new indicator from the Data box on the left. Select the theme, then indicator and then year to show the data. To view data just for one borough*, use the filter tool. The legend settings can be altered by clicking on the pencil icon next to the MSOA tick box within the map legend.
- l
Tree Trails - Knighton Park
- data.leicester.gov.uk
- leicester.opendatasoft.com
csv, excel, geojson +1Updated Nov 12, 2025ShareFacebookTwitterEmailClick to copy linkLink copiedCite(2025). Tree Trails - Knighton Park [Dataset]. https://data.leicester.gov.uk/explore/dataset/tree-trails-knighton-park/json, geojson, excel, csvAvailable download formatsDataset updatedNov 12, 2025LicenseOpen Government Licence 3.0http://www.nationalarchives.gov.uk/doc/open-government-licence/version/3/
License information was derived automaticallyDescriptionThe Knighton Park tree trail allows visitors to have a leisurely walk and find out interesting facts about many of the magnificent trees that reside within the park.The 23 trees are all marked with small round numbered metal tags.This dataset contains a table of tree details, images of the trees and maps. For users who wish to print out a map of the locations of the trees it is suggested to use the "Categorised Map" tab within the dataset for this purpose, accompanied by the table which can be downloaded via the "Export" tab.
- n
M.E. Jarvis et al. 2019: Radio Images, IFU cube and [O III] maps for...
- data.ncl.ac.uk
binUpdated May 30, 2023ShareFacebookTwitterEmailClick to copy linkLink copiedCiteChristopher Harrison (2023). M.E. Jarvis et al. 2019: Radio Images, IFU cube and [O III] maps for J0958+1439 [Dataset]. http://doi.org/10.25405/data.ncl.13238399.v1binAvailable download formatsUnique identifierhttps://doi.org/10.25405/data.ncl.13238399.v1Dataset updatedMay 30, 2023Dataset provided byNewcastle UniversityAuthorsChristopher HarrisonLicenseAttribution 4.0 (CC BY 4.0)https://creativecommons.org/licenses/by/4.0/
License information was derived automaticallyDescriptionThis relates to: M.E. Jarvis et al. 2019, MNRAS, 485, 2710, "Prevalence of radio jets associated with galactic outflows and feedback from quasars". Available on the pre-print archive: arxiv.org/abs/1902.07727This contains:- The Low Resolution ("LR") image and High Resolution ("HR") image from the Very Large Array (VLA) (see Table 3 and Section 3.1)- The eMERLIN image (see Section 3.2).- The IFU data cube used (see Section 3.3)- One file containing the four [O III] maps as four separate fits extensions (SNR, v50, W80 and A; see Section 4.2). Note the units for the v50 and W80 maps is angstroms.The details of how the images, data cubes and maps were produced are in the paper. The data files also contain extensive meta-data in the header following the standard for astronomical images.
- a
English Woodland Grant Scheme Boundary
- data-forestry.opendata.arcgis.com
- find.data.gov.scot
- +2more
Updated Nov 14, 2016+ more versionsShareFacebookTwitterEmailClick to copy linkLink copiedCitemapping.geodata_forestry (2016). English Woodland Grant Scheme Boundary [Dataset]. https://data-forestry.opendata.arcgis.com/datasets/b04623c9c3d046e8a4e94666b6617df8Dataset updatedNov 14, 2016Dataset authored and provided bymapping.geodata_forestryArea coveredDescriptionThe English Woodland Grant Scheme (EWGS) was launched in 2005 and offered 6 grants for the creation and stewardship of woodlands. This dataset contains the scheme or 'case' boundaries that make up the EWGS applications approved by the Forestry Commission. EWGS is now closed and was superseded by Countryside Stewardship in 2015. Grant types under EWGS: Woodland Planning Grant (WPG) - 'To support the preparation of woodland management plans' Designed primarily to aid the production of management plans - the foundation of sustainable management. The management plan template meets UKWAS planning requirements, thus assisting entry into certification. Woodland Assessment Grant (WAG) - 'To support information gathering that improves management decisions'. Designed to obtain further information, where there is an identified need. The information required should inform management decisions and reflect the sensitivity of the site and proposed work. Woodland Regeneration Grant (WRG) - 'To support desirable changes in woodland at the time of greatest opportunity'. Designed to support the re-establishment of trees when woodland felling has taken place. Woodland Improvement Grant (WIG) - 'To support capital projects in woodlands'. Designed to support work such as access tracks, uneconomic thinning, coppicing, rhododendron clearance and public access facilities. Woodland Management Grant (WMG) - 'To support the basic management activities that underpin woodland sustainability'. Designed to support operations that maintain or enhance the environmental and social value e.g. ride management, pest management, coppicing and uneconomic thinning. Woodland Creation Grant (WCG) - 'To support the creation of properly designed and well located new woodlands' Further information can be found in the 'EWGS General Guide' available from the Forestry Commission England's website in addition to the Regional Prospectus for particular grant types: http://www.forestry.gov.uk/ There are two spatial datasets associated with the EWGS. These represent the Case Boundary - this dataset - and the Sub-compartments that are encapsulated by a case boundary. Sub-compartments are available as a separate dataset and contain more detail about the grants awarded to each case. EWGS Sub-compartments vs case boundaries: Sub-compartments are the smallest mapped unit of grant aided area under the EWGS. Sub-compartments are aggregated up to Case Boundaries, and these boundaries are subsequently used to describe the overall extent of the EWGS case. A single case represents one application from an applicant for grant aid, and there may be a number of different grant types contained within a single case. All boundaries for cases that have been approved (and were not subsequently withdrawn without payment) from the inception of the EWGS are contained in this dataset. Some cases have passed out of the obligation period of the contract which they are under. These cases have a case status of 'Closed'. Attributes: CaseRef = EWGS Case unique identifier PropName = The case name FSArea = The Forestry Commission Area who dealt with the case CaseType = The case type DateApprv = The date the case was approved by the Forestry Commission CurrStat = The status of the case at the time the data was created AreaHa = Area in hectares of the case
Tree Trails - Humberstone Park - Dataset - data.gov.uk
- ckan.publishing.service.gov.uk
Updated Apr 6, 2023+ more versionsShareFacebookTwitterEmailClick to copy linkLink copiedCiteckan.publishing.service.gov.uk (2023). Tree Trails - Humberstone Park - Dataset - data.gov.uk [Dataset]. https://ckan.publishing.service.gov.uk/dataset/tree-trails-humberstone-parkDataset updatedApr 6, 2023DescriptionThe Humberstone Park tree trail allows visitors to have a leisurely walk and find out interesting facts about many of the magnificent trees that reside within the park.The 22 trees are all marked with small round numbered metal tags.This dataset contains a table of tree details, images of the trees and maps. For users who wish to print out a map of the locations of the trees it is suggested to use the "Categorised Map" tab within the dataset for this purpose, accompanied by the table which can be downloaded via the "Export" tab.
FacebookTwitterODC Public Domain Dedication and Licence (PDDL) v1.0http://www.opendatacommons.org/licenses/pddl/1.0/
License information was derived automatically
This is a collection of simple maps in PDF format that are designed to be printed off and used in the classroom. The include maps of Great Britain that show the location of major rivers, cities and mountains as well as maps of continents and the World. There is very little information on the maps to allow teachers to download them and add their own content to fit with their lesson plans. Customise one print out then photocopy them for your lesson. data not available yet, holding data set (7th August). Other. This dataset was first accessioned in the EDINA ShareGeo Open repository on 2012-08-07 and migrated to Edinburgh DataShare on 2017-02-22.