- d
Health Survey for England
- digital.nhs.uk
pdf, xlsxUpdated Dec 16, 2015+ more versions Share
Share Facebook
 Twitter
 EmailClick to copy linkLink copiedCite(2015). Health Survey for England [Dataset]. https://digital.nhs.uk/data-and-information/publications/statistical/health-survey-for-englandpdf(183.4 kB), pdf(545.3 kB), pdf(565.7 kB), xlsx(122.0 kB), pdf(490.2 kB), pdf(394.3 kB), pdf(358.5 kB), pdf(2.5 MB), xlsx(125.4 kB), pdf(188.1 kB), pdf(481.4 kB), xlsx(239.4 kB), xlsx(87.6 kB), xlsx(92.7 kB), pdf(884.4 kB), pdf(5.4 MB), xlsx(118.3 kB), xlsx(72.0 kB), pdf(578.8 kB), pdf(613.9 kB), pdf(250.5 kB), xlsx(158.5 kB), pdf(478.7 kB), xlsx(143.1 kB)Available download formatsDataset updatedDec 16, 2015License
https://digital.nhs.uk/about-nhs-digital/terms-and-conditionshttps://digital.nhs.uk/about-nhs-digital/terms-and-conditions
Time period coveredJan 1, 2014 - Dec 31, 2014Area coveredEnglandDescriptionThe Health Survey for England series was designed to monitor trends in the nation's health, to estimate the proportion of people in England who have specified health conditions, and to estimate the prevalence of risk factors associated with these conditions. The surveys provide regular information that cannot be obtained from other sources on a range of aspects concerning the public's health. The surveys have been carried out since 1994 by the Joint Health Surveys Unit of NatCen Social Research and the Research Department of Epidemiology and Public Health at UCL. Each survey in the series includes core questions and measurements (such as blood pressure, height and weight, and analysis of blood and saliva samples), as well as modules of questions on topics that vary from year to year. New topics this year include hearing and mental health. The achieved sample for the 2014 survey was 8,077 adults (aged 16 and over) and 2,003 children (aged 0-15). This year tables are in excel spreadsheets and the way the findings are presented in the report and summary has changed. We would very much like to hear readers' views about these changes. Please tell us via the short reader survey at the bottom of this page in Related links. Please note this release was updated on 15 January 2016 to add chapter 2 - Mental Health Problems and chapter 3 - Attitudes towards Mental Illness and their associated excel tables and to update the Summary of Key Findings.
Public Health Outcomes Framework: February 2014 quarterly data update
- gov.uk
Updated Feb 4, 2014+ more versionsShareFacebookTwitterEmailClick to copy linkLink copiedCitePublic Health England (2014). Public Health Outcomes Framework: February 2014 quarterly data update [Dataset]. https://www.gov.uk/government/statistics/public-health-outcomes-framework-february-2014-quarterly-data-updateDataset updatedFeb 4, 2014AuthorsPublic Health EnglandDescriptionThe Public Health Outcomes Framework (PHOF) data update for February 2014 has been published by Public Health England (PHE).
The data are presented in an interactive data tool that allows users to view data in a user-friendly format. The data tool also provides links to further supporting and relevant information to aid understanding of public health in a local population.
View the https://fingertips.phe.org.uk/profile/public-health-outcomes-framework">Public Health Outcomes Framework data tool.
This update will contain new baseline information for 15 indicators, more recent data for 46 indicators, additional lower tier local authority data for four indicators, equalities/inequalities breakdowns for 16 indicators, changes to 29 indicators to take account of population and other revisions, and 17 indicators with additional pre-baseline trend data.
View previous Public Health Outcomes Framework data tool updates.
Due to technical difficulties, the release of the indicators in the February update of PHOF was delayed by approximately 1 hour 10 minutes; PHE apologises for any inconvenience this may have caused.
Contact us
If you require further information about the PHOF data tool, https://fingertips.phe.org.uk/profile/public-health-outcomes-framework/supporting-information/contact-us">contact details are available on the PHE pages.
- 2
HSE
- datacatalogue.ukdataservice.ac.uk
Updated Sep 26, 2025+ more versionsShareFacebookTwitterEmailClick to copy linkLink copiedCiteUK Data Service (2025). HSE [Dataset]. http://doi.org/10.5255/UKDA-SN-7919-4Unique identifierhttps://doi.org/10.5255/UKDA-SN-7919-4Dataset updatedSep 26, 2025Area coveredEnglandDescriptionThe Health Survey for England (HSE) is a series of surveys designed to monitor trends in the nation's health. It was commissioned by NHS Digital and carried out by the Joint Health Surveys Unit of the National Centre for Social Research and the Department of Epidemiology and Public Health at University College London.The aims of the HSE series are:- to provide annual data about the nation’s health;
- to estimate the proportion of people in England with specified health conditions;
- to estimate the prevalence of certain risk factors associated with these conditions;
- to examine differences between population subgroups in their likelihood of having specific conditions or risk factors;
- to assess the frequency with which particular combinations of risk factors are found, and which groups these combinations most commonly occur;
- to monitor progress towards selected health targets
- since 1995, to measure the height of children at different ages, replacing the National Study of Health and Growth;
- since 1995, monitor the prevalence of overweight and obesity in children.
Further information about the series may be found on the NHS Digital Health Survey for England; health, social care and lifestyles webpage, the NatCen Social Research NatCen Health Survey for England webpage and the University College London Health and Social Surveys Research Group UCL Health Survey for England webpage.
Changes to the HSE from 2015:
Users should note that from 2015 survey onwards, only the individual data file is available under standard End User Licence (EUL). The household data file is now only included in the Special Licence (SL) version, released from 2015 onwards. In addition, the SL individual file contains all the variables included in the HSE EUL dataset, plus others, including variables removed from the EUL version after the NHS England disclosure review. The SL HSE is subject to more restrictive access conditions than the EUL version (see Access information). Users are advised to obtain the EUL version to see if it meets their needs before considering an application for the SL version.COVID-19 and the HSE:
The focus for the HSE 2014 was mental health. The survey also provided updates on core topics including smoking, drinking and general health. Additional topics covered are listed below.
Due to the COVID-19 pandemic, the HSE 2020 survey was stopped in March 2020 and never re-started. There was no publication that year. The survey resumed in 2021, albeit with an amended methodology. The full HSE resumed in 2022, with an extended fieldwork period. Due to this, the decision was taken not to progress with the 2023 survey, to maximise the 2022 survey response and enable more robust reporting of data. See the NHS Digital Health Survey for England - Health, social care and lifestyles webpage for more details.
Latest edition information
For the fourth edition (June 2023), the following changes have been made: 1) Variable MEDSNUM2G8 has been corrected and is now derived from MEDNUM2, which is the derived variable that excludes contraceptives and nicotine dependency drugs. 2) Variables SOC2010B and HRPSOC10B have had one category corrected that was incorrectly coded. 3) Variables NATID2 and NATID3 have had their labels corrected to NatID2 "National identity: Welsh" and NatID3 "National identity: Scottish". 4) Variables YNATSC2 and YNATSC3 have had their labels corrected to YNATSC2 "National identity: Welsh (SC)" and YNATSC3 "National identity: Scottish (SC)". 5) Some changes have been made to BMI derived variables: BMIVAL2, BMIVG8, BMIVGDR and WTVAL2 were incorrectly coded for one case, where the value '1' has been changed to '-1'; BMIVG5, BMIVG52, BMIVG53, BMI_GROUP, BMIVG3, BMIVG8 and BMIVGDR have had 3 cases recoded; BMISRG5 has had 4 cases recoded; and BMIVG8 has had one case recoded. 6) The variable label for ANTIBACTAK has been updated. 7) Fruit and Vegetable derived variables PORLGE, PORSML, POROTH, PORPUL, PORSAL, PORVEG, PORVDISH, PORJUICE, PORFRT, PORDRY, PORFROZ, PORFDISH, VEGPOR, FRTPOR, PORFV, PORFTVG, VEGYN, VDISHYN, FRTYN, FDISHYN, DRYYN, FROZYN PULYN, JUICEYN, SALYN, FVYN, PORFV05, VEGTYN, VEGTYN2, FRTTYN and FRTTYN2: these questions were only asked of children but some adult respondents had been included, mistakenly coded to 0 - these cases have now been recoded to '-1'. 8) The documentation has been updated to reflect these changes.
Health and Wellbeing of 15-year-olds in England - Main findings from the...
- gov.uk
Updated Dec 8, 2015+ more versionsShareFacebookTwitterEmailClick to copy linkLink copiedCiteHealth and Social Care Information Centre (2015). Health and Wellbeing of 15-year-olds in England - Main findings from the What About YOUth? Survey 2014 [Dataset]. https://www.gov.uk/government/statistics/health-and-wellbeing-of-15-year-olds-in-england-main-findings-from-the-what-about-youth-survey-2014Dataset updatedDec 8, 2015AuthorsHealth and Social Care Information CentreArea coveredEnglandDescriptionWhat About YOUth? 2014 (WAY 2014) is a newly-established survey designed to collect robust local authority (LA) level data on a range of health behaviours amongst 15 year-olds. Therefore, this is also the first report to be published from the survey, covering the smoking findings only in order to meet the PHOF release data requirements.
The Health and Social Care Information Centre (HSCIC) was commissioned by the Department of Health to run the survey in direct response to the Children and Young People’s Health Outcomes Forum. This Forum identified gaps in the Public Health Outcomes Framework (PHOF) and other key health behaviour measures relating to young people. HSCIC contracted Ipsos MORI to carry out the survey.
The PHOF included a placeholder indicator on smoking prevalence at age 15 and the data from this survey will now become the source for this PHOF indicator. This report covers all the information required for the PHOF on smoking prevalence plus other information on attitudes to smoking, e-cigarette use and use of other tobacco products (such as shisha) and will allow comparisons between LAs and against the national position.
The smoking prevalence findings needed for the PHOF have also been published by Public Health England (PHE) on 4 August 2015 via their Fingertips tool on their website (see resource links).
WAY 2014 is the first survey to be conducted of its kind and it is hoped that the survey will be repeated in order to form a time series of comparable data on a range of indicators for 15 year-olds across England. Other than smoking, data has been collected on other topics including general health, diet, use of free time, physical activity, drinking, emotional wellbeing, drugs and bullying. HSCIC plan to publish a main report covering all the key findings from the survey in December 2015. New data will become available to better inform local policy making for local authorities.
Presence of mental ill health in England 2014, by gender
- statista.com
Updated Dec 16, 2015ShareFacebookTwitterEmailClick to copy linkLink copiedCiteStatista (2015). Presence of mental ill health in England 2014, by gender [Dataset]. https://www.statista.com/statistics/339819/presence-of-mental-ill-health-by-gender-england/Dataset updatedDec 16, 2015Time period covered2014Area coveredUnited Kingdom (England)DescriptionThis statistic displays the presence of mental ill health or psychological disturbance in individuals, by gender in England, in 2014. In this year, 22 percent of men and 25 percent of women were found to have less than optimal mental health as measured by scoring 1 to 3 on the general health questionnaire (GHQ-12 score).
- d
Statistics on Smoking (replaced by Statistics on Public Health)
- digital.nhs.uk
csv, pdf, xlsUpdated Oct 8, 2014+ more versionsShareFacebookTwitterEmailClick to copy linkLink copiedCite(2014). Statistics on Smoking (replaced by Statistics on Public Health) [Dataset]. https://digital.nhs.uk/data-and-information/publications/statistical/statistics-on-smokingpdf(1.1 MB), csv(141.6 kB), xls(769.0 kB), pdf(182.6 kB), pdf(277.8 kB)Available download formatsDataset updatedOct 8, 2014Licensehttps://digital.nhs.uk/about-nhs-digital/terms-and-conditionshttps://digital.nhs.uk/about-nhs-digital/terms-and-conditions
Time period coveredApr 1, 2013 - Mar 31, 2014Area coveredUnited Kingdom, EnglandDescriptionThe HSCIC will be changing future publication dates for the four compendia reports which cover smoking, alcohol, drugs and obesity. The new dates for these reports will be approximately: - Smoking - will move from end August to end May. - Alcohol - will move from end May to end June. - Drugs - will move from end November to end March. - Obesity - will stay at end Feb (but 3rd March for 2015). One advantage of this change is that the Hospital Admissions data used in the Drugs compendia will now be able to use final data instead of provisional. A consequence is there will be no drugs compendia in 2015 with the next report being in March 2016. However, all the other data used in the report will be available from the sources where it is initially published. If you have any concerns over these changes then please send an email by 27 February 2015 to enquiries@hscic.gov.uk setting out your concerns. This statistical report presents a range of information on smoking which is drawn together from a variety of sources. The report aims to present a broad picture of health issues relating to smoking in England and covers topics such as smoking prevalence, habits, behaviours and attitudes among adults and school children, smoking-related ill health and mortality and smoking-related costs. This report combines data from different sources presenting it in a user-friendly format. It contains data and information previously published by the Health and Social Care Information Centre (HSCIC), Department of Health, the Office for National Statistics and Her Majesty's Revenue and Customs. The report also includes new analyses carried out by the Health and Social Care Information Centre.
Share of patients who saw NHS mental health services enough England...
- statista.com
Updated Nov 15, 2021ShareFacebookTwitterEmailClick to copy linkLink copiedCiteStatista (2021). Share of patients who saw NHS mental health services enough England 2014-2021 [Dataset]. https://www.statista.com/statistics/1082501/frequency-of-nhs-mental-health-visits-england/Dataset updatedNov 15, 2021Time period coveredSep 2020 - Nov 2020Area coveredEnglandDescriptionIn 2021, ** percent of respondents in England reported that they had definitely seen NHS mental health services enough times in the previous twelve months for their needs. Over the provided time interval the share of people who feel their needs are being met has decreased while the share who feel it is not being met has increased.
- d
Childhood Vaccination Coverage Statistics
- digital.nhs.uk
pdf, xlsx, zipUpdated Sep 23, 2015+ more versionsShareFacebookTwitterEmailClick to copy linkLink copiedCite(2015). Childhood Vaccination Coverage Statistics [Dataset]. https://digital.nhs.uk/data-and-information/publications/statistical/nhs-immunisation-statisticsxlsx(54.2 kB), zip(172.1 kB), pdf(387.6 kB), pdf(183.6 kB), pdf(487.4 kB), xlsx(972.3 kB), xlsx(98.0 kB), xlsx(67.7 kB), pdf(1.8 MB)Available download formatsDataset updatedSep 23, 2015Licensehttps://digital.nhs.uk/about-nhs-digital/terms-and-conditionshttps://digital.nhs.uk/about-nhs-digital/terms-and-conditions
Time period coveredApr 1, 2014 - Mar 31, 2015Area coveredUnited Kingdom, EnglandDescriptionThe information in this bulletin about immunisation statistics in England comes from Public Health England (PHE). Information on childhood immunisation coverage at ages 1, 2 and 5 years is collected through the Cover of Vaccination Evaluated Rapidly (COVER) data collection for Upper Tier Local Authorities (LAs) and Primary Care Trusts (PCTs). Information on children aged 2, 3 and 4 and adults aged 65 and over immunised against seasonal flu are collected from GPs through PHE's ImmForm system. 14 January 2016:Please note that Table 14a: Percentage of persons aged 65 and over immunised against Influenza (seasonal flu) by Local Authority, 2014-15 has been updated to include revised figures for City of London/Hackney and Westminster.
Confirmed Notifiable Disease Cases: England 2014 - Dataset - data.gov.uk
- ckan.publishing.service.gov.uk
Updated May 24, 2016+ more versionsShareFacebookTwitterEmailClick to copy linkLink copiedCiteckan.publishing.service.gov.uk (2016). Confirmed Notifiable Disease Cases: England 2014 - Dataset - data.gov.uk [Dataset]. https://ckan.publishing.service.gov.uk/dataset/confirmed-notifiable-disease-cases-england-2014Dataset updatedMay 24, 2016Area coveredEnglandDescriptionThis dataset provides figures for the number of confirmed Exotic Notifiable Disease investigations carried out by the Animal and Plant Health Agency in England during 2014. Investigations that follow the report of an exotic notifiable disease are called 'report cases'. Notifiable diseases in this context are animal diseases that an animal owner/keeper is under legal obligation to report to the Animal and Plant Health Agency (APHA), even if there is only a suspicion that an animal may be affected. 'Exotic diseases' are defined as diseases that are not currently present within the United Kingdom. This dataset is formatted in two sections: the first provides information on who reported suspicion of disease where a report case was instigated as a result of clinical suspicion; the second half of the spreadsheet identifies why an animal was tested where report cases were started as a result of a non-negative lab result. e.g. as part of an active surveillance programme, or as part of pre-breeding tests, etc. Disease is confirmed by the Chief Veterinary Officer following an investigation by APHA which includes clinical investigation and laboratory testing. For further information and explanations of the data included in this dataset, please see the document available for download alongside this dataset titled 'NDI Cases - Additional Information'. Attribution statement: ©Crown Copyright, APHA 2016
Cancer survival in England for patients diagnosed between 2014 and 2018, and...
- s3.amazonaws.com
- gov.uk
Updated Nov 16, 2021+ more versionsShareFacebookTwitterEmailClick to copy linkLink copiedCitePublic Health England (2021). Cancer survival in England for patients diagnosed between 2014 and 2018, and followed up until 2019 [Dataset]. https://s3.amazonaws.com/thegovernmentsays-files/content/176/1766836.htmlDataset updatedNov 16, 2021AuthorsPublic Health EnglandArea coveredEnglandDescriptionThis cancer survival bulletin includes estimates for adults and children in England, by stage of diagnosis and by NHS Region, Cancer Alliance (CA) and Sustainability and Transformation Partnerships (STP), together with trend analyses to assess geographical improvements over time.
Health and Wellbeing of 15-year-olds (What About Youth Survey), Borough
- ckan.publishing.service.gov.uk
Updated Jun 9, 2025+ more versionsShareFacebookTwitterEmailClick to copy linkLink copiedCiteckan.publishing.service.gov.uk (2025). Health and Wellbeing of 15-year-olds (What About Youth Survey), Borough [Dataset]. https://ckan.publishing.service.gov.uk/dataset/health-and-wellbeing-of-15-year-olds-what-about-youth-survey-boroughDataset updatedJun 9, 2025DescriptionHealth and Wellbeing of 15-year-olds in England - results from What About Youth Survey. Data has been collected on general health, diet, use of free time, physical activity, smoking, drinking, emotional wellbeing, drugs and bullying. What About YOUth? 2014 (WAY 2014) is a newly-established survey designed to collect robust local authority (LA) level data on a range of health behaviours amongst 15 year-olds. WAY 2014 is the first survey to be conducted of its kind and it is hoped that the survey will be repeated in order to form a time series of comparable data on a range of indicators for 15 year-olds across England. Questionnaire packs were sent to 295,245 young people in England and 120,115 of these responded with usable data, giving an unadjusted response rate of 40 per cent (based on the issued sample) and an adjusted response rate of 41 per cent. Participants for WAY 2014 were sampled from the Department for Education’s National Pupil Database (NPD). The NPD is a near full population database (with the exception that independent schools are not included). More Information from The Health and Social Care Information Centre (HSCIC) website and data downloads available from PHE Fingertips.
NDNS: assessment of dietary sodium in adults in England, 2014
- gov.uk
Updated Mar 22, 2016ShareFacebookTwitterEmailClick to copy linkLink copiedCitePublic Health England (2016). NDNS: assessment of dietary sodium in adults in England, 2014 [Dataset]. https://www.gov.uk/government/statistics/national-diet-and-nutrition-survey-assessment-of-dietary-sodium-in-adults-in-england-2014Dataset updatedMar 22, 2016AuthorsPublic Health EnglandDescriptionThe assessment of dietary sodium report forms part of Public Health England’s National Diet and Nutrition Survey (NDNS) series.
This report presents results of estimated salt intake, based on 24-hour urinary sodium excretion, in adults (aged 19 to 64 years) in England for 2014.
- d
Cervical Screening (Annual)
- digital.nhs.uk
pdf, ppt, xlsx, zipUpdated Nov 10, 2015ShareFacebookTwitterEmailClick to copy linkLink copiedCite(2015). Cervical Screening (Annual) [Dataset]. https://digital.nhs.uk/data-and-information/publications/statistical/cervical-screening-annualpdf(347.3 kB), ppt(7.3 MB), zip(254.1 kB), pdf(181.3 kB), xlsx(492.8 kB), pdf(768.6 kB), zip(222.7 kB)Available download formatsDataset updatedNov 10, 2015Licensehttps://digital.nhs.uk/about-nhs-digital/terms-and-conditionshttps://digital.nhs.uk/about-nhs-digital/terms-and-conditions
Time period coveredApr 1, 2014 - Mar 31, 2015Area coveredEnglandDescriptionThis report presents information about the NHS Cervical Screening Programme in England in 2014-15 and includes data on the call and recall system, on screening samples examined by pathology laboratories and on referrals to colposcopy clinics. 13 January 2016: Please note the denominator description of the Abnormal Predictive Value (APV) measure, under Appendix B: Definitions section of the 2014-15 Cervical Screening publication, has been updated to reflect the correct test result of low-grade dyskaryosis (borderline or mild). We apologise for any inconvenience caused. Update 19 July 2019: NHS Digital have been made aware of errors or omissions in the CSV files relating to Tables 1, 1a, 11, 13, 18, 19a, 26a and 26b. This data has now been replaced. Please note, the original data contained within the Excel data tables file was correct. Only the csv files mentioned were incorrect.
- e
Better Health for London: One Year On
- data.europa.eu
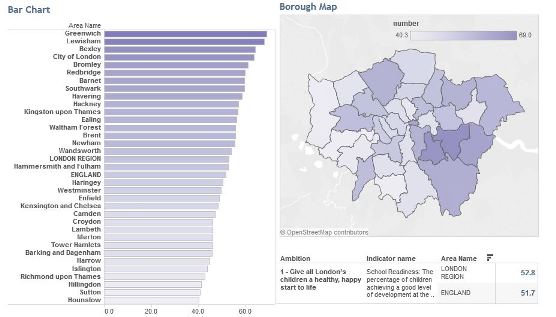
unknownUpdated Oct 21, 2025+ more versionsShareFacebookTwitterEmailClick to copy linkLink copiedCitePublic Health England (2025). Better Health for London: One Year On [Dataset]. https://data.europa.eu/data/datasets/23nk3?locale=etunknownAvailable download formatsDataset updatedOct 21, 2025Dataset authored and provided byPublic Health EnglandArea coveredLondonDescriptionThis data outlines the latest data measuring the 10 key aspirations for London's Health as part of the overarching goal to make London the world's healthiest major global city. This page contains the initial baseline data published in 2014 in the report "Better Health for London: Next Steps", and updates these with more recent data and/or breaks these down by London Borough where these data are available.
Better Health for London: Next Steps has been developed with London Councils, the GLA, London CCGs and the London regional teams of Public Health England and NHS England.
Watch the Video relating to the report
See some of the data represented in Tableau
- d
Statistics on Alcohol (replaced by Statistics on Public Health)
- digital.nhs.uk
csv, pdf, xlsx, zipUpdated Oct 1, 2014ShareFacebookTwitterEmailClick to copy linkLink copiedCite(2014). Statistics on Alcohol (replaced by Statistics on Public Health) [Dataset]. https://digital.nhs.uk/data-and-information/publications/statistical/statistics-on-alcoholzip(320.5 kB), zip(1.7 MB), pdf(626.1 kB), xlsx(4.6 MB), pdf(136.2 kB), csv(262.3 kB), pdf(182.5 kB)Available download formatsDataset updatedOct 1, 2014Licensehttps://digital.nhs.uk/about-nhs-digital/terms-and-conditionshttps://digital.nhs.uk/about-nhs-digital/terms-and-conditions
Time period coveredApr 1, 2003 - Mar 31, 2013Area coveredEnglandDescriptionThis statistical report acts as a reference point for health issues relating to alcohol use and misuse, providing information obtained from a number of sources in a user-friendly format. It covers topics such as drinking habits and behaviours among adults (aged 16 and over) and school children (aged 11 to 15); drinking-related ill health and mortality; affordability of alcohol; alcohol-related admissions to hospital; and alcohol-related costs. The report contains previously published information and also includes additional new analyses. The new analyses are mainly obtained from the Health and Social Care Information Centre's (HSCIC) Hospital Episode Statistics (HES) system, and prescribing data. The report also includes up-to-date information on the latest alcohol related government policies and ambitions and contains links to further sources of useful information. The report used a revised methodology for estimating alcohol-related hospital admissions following a review by Public Health England, the Department of Health and the Health and Social Care Information Centre. Consequently estimates of alcohol-related hospital admissions for 2012-13, reported in this publication, are not comparable to estimates in earlier years' publications. A back time series of estimates of alcohol-related hospital admissions, calculated using the revised methodology, for the years 2003-04 to 2011-12 were made available as additional tables on the 1st October 2014. They provide a comparable 10 year time series from 2003-04 to 2012-13. On 11th June 2014, paragraph 4.3.2 concerning Specialist alcohol treatment was amended slightly to improve clarity. Please note: on 1st December 2014 an error was identified in the figures for East Sussex in tables 4.3 and 4.6 for all years and has now been corrected. In previous versions, the total for East Sussex was excluding the figures for Wealden.
National Control Plan for Salmonella Chicken Breeder Flocks APHA Sampled...
- environment.data.gov.uk
- ckan.publishing.service.gov.uk
- +3more
csvUpdated Jun 20, 2016+ more versionsShareFacebookTwitterEmailClick to copy linkLink copiedCiteAnimal & Plant Health Agency (2016). National Control Plan for Salmonella Chicken Breeder Flocks APHA Sampled England 2014 [Dataset]. https://environment.data.gov.uk/dataset/dc1dbd66-13d1-4bc1-ad93-bf0ac92f103fcsvAvailable download formatsDataset updatedJun 20, 2016AuthorsAnimal & Plant Health AgencyLicenseOpen Government Licence 3.0http://www.nationalarchives.gov.uk/doc/open-government-licence/version/3/
License information was derived automaticallyArea coveredEnglandDescriptionThis dataset details the chicken breeder flocks in England where official routine sampling, under the National Control Programmes for Salmonella, was carried out by Animal and Plant Health Agency staff in 2014. The dataset details region, the date of the sampling visit, flock type, the number of flocks sampled for salmonella and the result.
Impact of increased influenza vaccination in 2–3-year-old children on...
- plos.figshare.com
docxUpdated Jun 1, 2023ShareFacebookTwitterEmailClick to copy linkLink copiedCiteSankarasubramanian Rajaram; Witold Wiecek; Richard Lawson; Betina T. Blak; Yanli Zhao; Judith Hackett; Robert Brody; Vishal Patel; Billy Amzal (2023). Impact of increased influenza vaccination in 2–3-year-old children on disease burden within the general population: A Bayesian model-based approach [Dataset]. http://doi.org/10.1371/journal.pone.0186739docxAvailable download formatsUnique identifierhttps://doi.org/10.1371/journal.pone.0186739Dataset updatedJun 1, 2023AuthorsSankarasubramanian Rajaram; Witold Wiecek; Richard Lawson; Betina T. Blak; Yanli Zhao; Judith Hackett; Robert Brody; Vishal Patel; Billy AmzalLicenseAttribution 4.0 (CC BY 4.0)https://creativecommons.org/licenses/by/4.0/
License information was derived automaticallyDescriptionIntroductionDuring the 2013–2014 influenza season, Public Health England extended routine influenza vaccination to all 2- and 3-year-old children in England. To estimate the impact of this change in policy on influenza-related morbidity and mortality, we developed a disease transmission and surveillance model informed by real-world data.MethodsWe combined real-world and literature data sources to construct a model of influenza transmission and surveillance in England. Data were obtained for four influenza seasons, starting with the 2010–2011 season. Bayesian inference was used to estimate model parameters on a season-by-season basis to assess the impact of targeting 2- and 3-year-old children for influenza vaccination. This provided the basis for the construction of counterfactual scenarios comparing vaccination rates of ~2% and ~35% in the 2- and 3- year-old population to estimate reductions in general practitioner (GP) influenza-like-illness (ILI) consultations, respiratory hospitalizations and deaths in the overall population.ResultsOur model was able to replicate the main patterns of influenza across the four seasons as observed through laboratory surveillance data. Targeting 2- and 3-year-old children for influenza vaccination resulted in reductions in the general population of between 6.2–9.9% in influenza-attributable GP ILI consultations, 6.1–10.7% in influenza-attributable respiratory hospitalizations, and 5.7–9.4% in influenza-attributable deaths. The decrease in influenza-attributable ILI consultations represents a reduction of between 4.5% and 7.3% across all ILI consultations. The reduction in influenza-attributable respiratory hospitalizations represents a reduction of between 1.2% and 2.3% across all respiratory hospitalizations. Reductions in influenza-attributable respiratory deaths represent a reduction of between 0.9% and 2.4% in overall respiratory deaths.ConclusionThis study has provided evidence that extending routine influenza vaccination to all healthy children aged 2 and 3 years old leads to benefits in terms of reduced utilization of healthcare resources and fewer respiratory health outcomes and deaths.
Local Health Boards (December 2014) - Dataset - data.gov.uk
- ckan.publishing.service.gov.uk
Updated Feb 18, 2019+ more versionsShareFacebookTwitterEmailClick to copy linkLink copiedCiteckan.publishing.service.gov.uk (2019). Local Health Boards (December 2014) - Dataset - data.gov.uk [Dataset]. https://ckan.publishing.service.gov.uk/dataset/local-health-boards-december-20141Dataset updatedFeb 18, 2019DescriptionData identifying the location of welsh Local Health Boards. For more information, please see the ONS Geoportal website. Boundaries for these geographies have been generalised (to 20 metres) and clipped. You can find further information on these formats in the downloadable Boundary Guidance document on the Open Geography portal. When using boundary data, please acknowledge the copyright and the source of the data by including the following attribution statements: Contains National Statistics data © Crown copyright and database right (2016) Contains OS data © Crown copyright and database right (2016) For more details about licencing go to: https://www.ons.gov.uk/methodology/geography/licences All data is correct as of download date: 21/11/2016
South West England: share of physically inactive people 2014, by local...
- statista.com
Updated Feb 16, 2014ShareFacebookTwitterEmailClick to copy linkLink copiedCiteStatista (2014). South West England: share of physically inactive people 2014, by local authority [Dataset]. https://www.statista.com/statistics/656960/south-west-england-share-of-inactive-people-by-local-authority/Dataset updatedFeb 16, 2014Time period covered2013 - 2014Area coveredEnglandDescriptionThis statistic displays the share of physically inactive people in the South West region in England in 2013/2014, by local authority. In 2013/2014, approximately ** percent of the people in Dorset were physically inactive.
Risk level of individuals who consume alcohol in England 2014
- statista.com
Updated Dec 2, 2016ShareFacebookTwitterEmailClick to copy linkLink copiedCiteStatista (2016). Risk level of individuals who consume alcohol in England 2014 [Dataset]. https://www.statista.com/statistics/646263/alcohol-consumers-risk-level-england/Dataset updatedDec 2, 2016Time period covered2014Area coveredEnglandDescriptionThis statistic displays the share of individuals who consume alcohol in England in 2014, by risk level. Approximately ** percent of individuals are drinking at lower risk, however **** percent of the population are drinking at higher risk.
FacebookTwitterhttps://digital.nhs.uk/about-nhs-digital/terms-and-conditionshttps://digital.nhs.uk/about-nhs-digital/terms-and-conditions
The Health Survey for England series was designed to monitor trends in the nation's health, to estimate the proportion of people in England who have specified health conditions, and to estimate the prevalence of risk factors associated with these conditions. The surveys provide regular information that cannot be obtained from other sources on a range of aspects concerning the public's health. The surveys have been carried out since 1994 by the Joint Health Surveys Unit of NatCen Social Research and the Research Department of Epidemiology and Public Health at UCL. Each survey in the series includes core questions and measurements (such as blood pressure, height and weight, and analysis of blood and saliva samples), as well as modules of questions on topics that vary from year to year. New topics this year include hearing and mental health. The achieved sample for the 2014 survey was 8,077 adults (aged 16 and over) and 2,003 children (aged 0-15). This year tables are in excel spreadsheets and the way the findings are presented in the report and summary has changed. We would very much like to hear readers' views about these changes. Please tell us via the short reader survey at the bottom of this page in Related links. Please note this release was updated on 15 January 2016 to add chapter 2 - Mental Health Problems and chapter 3 - Attitudes towards Mental Illness and their associated excel tables and to update the Summary of Key Findings.