- T
United States Economic Optimism Index
- tradingeconomics.com
- ru.tradingeconomics.com
- +13more
csv, excel, json, xmlUpdated Jul 1, 2025 Share
Share Facebook
 Twitter
 EmailClick to copy linkLink copiedCiteTRADING ECONOMICS (2025). United States Economic Optimism Index [Dataset]. https://tradingeconomics.com/united-states/economic-optimism-indexcsv, json, xml, excelAvailable download formatsDataset updatedJul 1, 2025Dataset authored and provided byTRADING ECONOMICSLicense
Attribution 4.0 (CC BY 4.0)https://creativecommons.org/licenses/by/4.0/
License information was derived automaticallyTime period coveredFeb 28, 2001 - Jul 31, 2025Area coveredUnited StatesDescriptionEconomic Optimism Index in the United States decreased to 48.60 points in July from 49.20 points in June of 2025. This dataset provides the latest reported value for - United States IBD/TIPP Economic Optimism Index - plus previous releases, historical high and low, short-term forecast and long-term prediction, economic calendar, survey consensus and news.
VN30 Index: Analysts Bullish Amidst Market Optimism. (Forecast)
- kappasignal.com
Updated Feb 28, 2025ShareFacebookTwitterEmailClick to copy linkLink copiedCiteKappaSignal (2025). VN30 Index: Analysts Bullish Amidst Market Optimism. (Forecast) [Dataset]. https://www.kappasignal.com/2025/02/vn30-index-analysts-bullish-amidst.htmlDataset updatedFeb 28, 2025Dataset authored and provided byKappaSignalLicensehttps://www.kappasignal.com/p/legal-disclaimer.htmlhttps://www.kappasignal.com/p/legal-disclaimer.html
DescriptionThis analysis presents a rigorous exploration of financial data, incorporating a diverse range of statistical features. By providing a robust foundation, it facilitates advanced research and innovative modeling techniques within the field of finance.
VN30 Index: Analysts Bullish Amidst Market Optimism.
Financial data:
Historical daily stock prices (open, high, low, close, volume)
Fundamental data (e.g., market capitalization, price to earnings P/E ratio, dividend yield, earnings per share EPS, price to earnings growth, debt-to-equity ratio, price-to-book ratio, current ratio, free cash flow, projected earnings growth, return on equity, dividend payout ratio, price to sales ratio, credit rating)
Technical indicators (e.g., moving averages, RSI, MACD, average directional index, aroon oscillator, stochastic oscillator, on-balance volume, accumulation/distribution A/D line, parabolic SAR indicator, bollinger bands indicators, fibonacci, williams percent range, commodity channel index)
Machine learning features:
Feature engineering based on financial data and technical indicators
Sentiment analysis data from social media and news articles
Macroeconomic data (e.g., GDP, unemployment rate, interest rates, consumer spending, building permits, consumer confidence, inflation, producer price index, money supply, home sales, retail sales, bond yields)
Potential Applications:
Stock price prediction
Portfolio optimization
Algorithmic trading
Market sentiment analysis
Risk management
Use Cases:
Researchers investigating the effectiveness of machine learning in stock market prediction
Analysts developing quantitative trading Buy/Sell strategies
Individuals interested in building their own stock market prediction models
Students learning about machine learning and financial applications
Additional Notes:
The dataset may include different levels of granularity (e.g., daily, hourly)
Data cleaning and preprocessing are essential before model training
Regular updates are recommended to maintain the accuracy and relevance of the data
Optimism Price Prediction for 2025-08-08
- coinunited.io
Updated Jul 16, 2025+ more versionsShareFacebookTwitterEmailClick to copy linkLink copiedCiteCoinUnited.io (2025). Optimism Price Prediction for 2025-08-08 [Dataset]. https://coinunited.io/en/data/prices/crypto/optimism-op/price-predictionDataset updatedJul 16, 2025Dataset provided byCoinUnited.ioDescriptionBased on professional technical analysis and AI models, deliver precise price‑prediction data for Optimism on 2025-08-08. Includes multi‑scenario analysis (bullish, baseline, bearish), risk assessment, technical‑indicator insights and market‑trend forecasts to help investors make informed trading decisions and craft sound investment strategies.
United States SBOI: sa: Prices: Price Plans
- ceicdata.com
Updated Nov 27, 2021ShareFacebookTwitterEmailClick to copy linkLink copiedCiteCEICdata.com, United States SBOI: sa: Prices: Price Plans [Dataset]. https://www.ceicdata.com/en/united-states/nfib-index-of-small-business-optimism/sboi-sa-prices-price-plansDataset updatedNov 27, 2021Dataset provided byCEIC DataLicenseAttribution 4.0 (CC BY 4.0)https://creativecommons.org/licenses/by/4.0/
License information was derived automaticallyTime period coveredMay 1, 2017 - Apr 1, 2018Area coveredUnited StatesVariables measuredBusiness Confidence SurveyDescriptionUnited States SBOI: sa: Prices: Price Plans data was reported at 28.000 % in Oct 2018. This records an increase from the previous number of 24.000 % for Sep 2018. United States SBOI: sa: Prices: Price Plans data is updated monthly, averaging 19.000 % from Jan 1975 (Median) to Oct 2018, with 438 observations. The data reached an all-time high of 46.000 % in Oct 1979 and a record low of 0.000 % in Mar 2009. United States SBOI: sa: Prices: Price Plans data remains active status in CEIC and is reported by National Federation of Independent Business. The data is categorized under Global Database’s United States – Table US.S017: NFIB Index of Small Business Optimism.
Survey on optimism or pessimism 2013
- statista.com
Updated Jul 15, 2013ShareFacebookTwitterEmailClick to copy linkLink copiedCiteStatista (2013). Survey on optimism or pessimism 2013 [Dataset]. https://www.statista.com/statistics/262675/survey-on-optimism-or-pessimism/Dataset updatedJul 15, 2013Time period coveredJun 20, 2013Area coveredUnited StatesDescriptionThis statistic shows the results of a survey, conducted in 2013 among adult Americans, on whether they believe the glass is half full or half empty. 50 percent of respondents said they consider themselves optimists.
The optimism and pessimism of the American people
Optimism is defined as a mental attitude or worldview that favors a positive outcome, while pessimism favors a negative outcome or prediction. Depression in the United States is very common. In 2013, around 8.7 percent of U.S. adults aged between 18 and 25 reported that they had a major depression episode within the past year. Major depressive episodes in the United States are most common among American females. The number of prescription antidepressant drug use among women in the United States has increased by more than 10 percent between 1988 and 2012. Also in 2013, about one third of U.S. adults stated that they were happier than expected.
The general optimism and pessimism in a nation are often the result of its economic situation. The unemployment rate in the United States has been steadily decreasing every year since 2010; furthermore, it is expected to constantly decrease further until 2020. The prospering economy and increasing gross domestic product per capita in the United States is another source of optimism for the American people: The GDP per capita in the United States in 2014 was around 54,600 U.S. dollars. Moreover, it has been steadily increasing since 2010. In a survey conducted in July 2012, one third of Americans who defined themselves as lower-class stated that they were “not too happy” with their current lives. On the other hand, there was a larger percentage of people whom, according to themselves, belong to the upper class that stated that they were “very happy” with their current lives. In addition, upper- and middle-class American adults are more optimistic about the country’s long-term economic future in comparison to lower-class American adults.
- t
OP Mainnet Cost of revenue Metrics
- tokenterminal.com
csv, jsonUpdated Mar 13, 2025ShareFacebookTwitterEmailClick to copy linkLink copiedCiteToken Terminal (2025). OP Mainnet Cost of revenue Metrics [Dataset]. https://tokenterminal.com/explorer/projects/optimismjson, csvAvailable download formatsDataset updatedMar 13, 2025Dataset authored and provided byToken TerminalLicensehttps://tokenterminal.com/termshttps://tokenterminal.com/terms
Time period covered2020 - PresentVariables measuredCost of revenueDescriptionDetailed Cost of revenue metrics and analytics for OP Mainnet, including historical data and trends.
- U
United States SBOI: Credit Conditions: Relative Interest Rate Paid
- ceicdata.com
Updated Nov 22, 2021ShareFacebookTwitterEmailClick to copy linkLink copiedCiteCEICdata.com (2021). United States SBOI: Credit Conditions: Relative Interest Rate Paid [Dataset]. https://www.ceicdata.com/en/united-states/nfib-index-of-small-business-optimism/sboi-credit-conditions-relative-interest-rate-paidDataset updatedNov 22, 2021Dataset provided byCEICdata.comLicenseAttribution 4.0 (CC BY 4.0)https://creativecommons.org/licenses/by/4.0/
License information was derived automaticallyTime period coveredMay 1, 2017 - Apr 1, 2018Area coveredUnited StatesVariables measuredBusiness Confidence SurveyDescriptionUnited States SBOI: Credit Conditions: Relative Interest Rate Paid data was reported at 17.000 % in Oct 2018. This records an increase from the previous number of 16.000 % for Sep 2018. United States SBOI: Credit Conditions: Relative Interest Rate Paid data is updated monthly, averaging 2.000 % from Jan 1986 (Median) to Oct 2018, with 394 observations. The data reached an all-time high of 38.000 % in Mar 1989 and a record low of -28.000 % in Apr 1986. United States SBOI: Credit Conditions: Relative Interest Rate Paid data remains active status in CEIC and is reported by National Federation of Independent Business. The data is categorized under Global Database’s United States – Table US.S017: NFIB Index of Small Business Optimism.
- U
United States SBOI: Credit Conditions: Actual Interest Rate Paid on ST Loans...
- ceicdata.com
Updated Apr 3, 2018ShareFacebookTwitterEmailClick to copy linkLink copiedCiteCEICdata.com (2018). United States SBOI: Credit Conditions: Actual Interest Rate Paid on ST Loans [Dataset]. https://www.ceicdata.com/en/united-states/nfib-index-of-small-business-optimism/sboi-credit-conditions-actual-interest-rate-paid-on-st-loansDataset updatedApr 3, 2018Dataset provided byCEICdata.comLicenseAttribution 4.0 (CC BY 4.0)https://creativecommons.org/licenses/by/4.0/
License information was derived automaticallyTime period coveredMay 1, 2017 - Apr 1, 2018Area coveredUnited StatesVariables measuredBusiness Confidence SurveyDescriptionUnited States SBOI: Credit Conditions: Actual Interest Rate Paid on ST Loans data was reported at 6.100 % in Nov 2018. This records a decrease from the previous number of 6.400 % for Oct 2018. United States SBOI: Credit Conditions: Actual Interest Rate Paid on ST Loans data is updated monthly, averaging 8.430 % from Jan 1986 (Median) to Nov 2018, with 395 observations. The data reached an all-time high of 12.920 % in May 1989 and a record low of 4.700 % in Nov 2015. United States SBOI: Credit Conditions: Actual Interest Rate Paid on ST Loans data remains active status in CEIC and is reported by National Federation of Independent Business. The data is categorized under Global Database’s United States – Table US.S017: NFIB Index of Small Business Optimism.
United States SBOI: sa: Most Pressing Problem: Survey Low: Fin. & Interest...
- ceicdata.com
Updated Dec 15, 2022ShareFacebookTwitterEmailClick to copy linkLink copiedCiteCEICdata.com (2022). United States SBOI: sa: Most Pressing Problem: Survey Low: Fin. & Interest Rates [Dataset]. https://www.ceicdata.com/en/united-states/nfib-index-of-small-business-optimism/sboi-sa-most-pressing-problem-survey-low-fin--interest-ratesDataset updatedDec 15, 2022Dataset provided byCEIC DataLicenseAttribution 4.0 (CC BY 4.0)https://creativecommons.org/licenses/by/4.0/
License information was derived automaticallyTime period coveredMar 1, 2024 - Feb 1, 2025Area coveredUnited StatesVariables measuredBusiness Confidence SurveyDescriptionUnited States SBOI: sa: Most Pressing Problem: Survey Low: Fin. & Interest Rates data was reported at 0.000 % in Mar 2025. This stayed constant from the previous number of 0.000 % for Feb 2025. United States SBOI: sa: Most Pressing Problem: Survey Low: Fin. & Interest Rates data is updated monthly, averaging 1.000 % from Jan 2014 (Median) to Mar 2025, with 131 observations. The data reached an all-time high of 2.000 % in Jul 2019 and a record low of 0.000 % in Mar 2025. United States SBOI: sa: Most Pressing Problem: Survey Low: Fin. & Interest Rates data remains active status in CEIC and is reported by National Federation of Independent Business. The data is categorized under Global Database’s United States – Table US.S042: NFIB Index of Small Business Optimism. [COVID-19-IMPACT]
- w
Global Guarded Optimism Market Research Report: By Consumer Segment...
- wiseguyreports.com
Updated Jul 27, 2025ShareFacebookTwitterEmailClick to copy linkLink copiedCitewWiseguy Research Consultants Pvt Ltd (2025). Global Guarded Optimism Market Research Report: By Consumer Segment (Individuals, Families, Millennials, Seniors), By Application Area (Mental Health, Personal Development, Work-Life Balance), By Delivery Method (Online Platforms, Workshops, Mobile Applications), By Income Level (Low Income, Middle Income, High Income) and By Regional (North America, Europe, South America, Asia Pacific, Middle East and Africa) - Forecast to 2032. [Dataset]. https://www.wiseguyreports.com/reports/guarded-optimism-marketDataset updatedJul 27, 2025Dataset authored and provided bywWiseguy Research Consultants Pvt LtdLicensehttps://www.wiseguyreports.com/pages/privacy-policyhttps://www.wiseguyreports.com/pages/privacy-policy
Area coveredGlobalDescriptionBASE YEAR 2024 HISTORICAL DATA 2019 - 2024 REPORT COVERAGE Revenue Forecast, Competitive Landscape, Growth Factors, and Trends MARKET SIZE 2023 15.9(USD Billion) MARKET SIZE 2024 16.72(USD Billion) MARKET SIZE 2032 25.0(USD Billion) SEGMENTS COVERED Consumer Segment, Application Area, Delivery Method, Income Level, Regional COUNTRIES COVERED North America, Europe, APAC, South America, MEA KEY MARKET DYNAMICS Consumer confidence trends, Economic uncertainty effects, Mental health awareness growth, Sustainable optimism adoption, Innovation in guided strategies MARKET FORECAST UNITS USD Billion KEY COMPANIES PROFILED Square, Microsoft, Cisco Systems, Oracle, Amazon, IBM, NVIDIA, Salesforce, SAP, Dell Technologies, Accenture, Google, Palantir Technologies, Apple, Meta Platforms MARKET FORECAST PERIOD 2025 - 2032 KEY MARKET OPPORTUNITIES Rising consumer confidence levels, Increasing demand for mental wellness, Growth in digital wellness platforms, Expansion in corporate wellness programs, Enhanced focus on sustainability initiatives COMPOUND ANNUAL GROWTH RATE (CAGR) 5.16% (2025 - 2032) United States SBOI: sa: Most Pressing Problem: Fin. & Interest Rates
- ceicdata.com
Updated Feb 15, 2025ShareFacebookTwitterEmailClick to copy linkLink copiedCiteCEICdata.com (2025). United States SBOI: sa: Most Pressing Problem: Fin. & Interest Rates [Dataset]. https://www.ceicdata.com/en/united-states/nfib-index-of-small-business-optimism/sboi-sa-most-pressing-problem-fin--interest-ratesDataset updatedFeb 15, 2025Dataset provided byCEIC DataLicenseAttribution 4.0 (CC BY 4.0)https://creativecommons.org/licenses/by/4.0/
License information was derived automaticallyTime period coveredMar 1, 2024 - Feb 1, 2025Area coveredUnited StatesVariables measuredBusiness Confidence SurveyDescriptionUnited States SBOI: sa: Most Pressing Problem: Fin. & Interest Rates data was reported at 3.000 % in Mar 2025. This stayed constant from the previous number of 3.000 % for Feb 2025. United States SBOI: sa: Most Pressing Problem: Fin. & Interest Rates data is updated monthly, averaging 2.000 % from Jan 2014 (Median) to Mar 2025, with 131 observations. The data reached an all-time high of 6.000 % in May 2024 and a record low of 0.000 % in Feb 2022. United States SBOI: sa: Most Pressing Problem: Fin. & Interest Rates data remains active status in CEIC and is reported by National Federation of Independent Business. The data is categorized under Global Database’s United States – Table US.S042: NFIB Index of Small Business Optimism. [COVID-19-IMPACT]
VistaGen's Future: Analyst Optimism Fuels (VTGN) Stock Forecasts (Forecast)
- kappasignal.com
Updated May 13, 2025ShareFacebookTwitterEmailClick to copy linkLink copiedCiteKappaSignal (2025). VistaGen's Future: Analyst Optimism Fuels (VTGN) Stock Forecasts (Forecast) [Dataset]. https://www.kappasignal.com/2025/05/vistagens-future-analyst-optimism-fuels.htmlDataset updatedMay 13, 2025Dataset authored and provided byKappaSignalLicensehttps://www.kappasignal.com/p/legal-disclaimer.htmlhttps://www.kappasignal.com/p/legal-disclaimer.html
DescriptionThis analysis presents a rigorous exploration of financial data, incorporating a diverse range of statistical features. By providing a robust foundation, it facilitates advanced research and innovative modeling techniques within the field of finance.
VistaGen's Future: Analyst Optimism Fuels (VTGN) Stock Forecasts
Financial data:
Historical daily stock prices (open, high, low, close, volume)
Fundamental data (e.g., market capitalization, price to earnings P/E ratio, dividend yield, earnings per share EPS, price to earnings growth, debt-to-equity ratio, price-to-book ratio, current ratio, free cash flow, projected earnings growth, return on equity, dividend payout ratio, price to sales ratio, credit rating)
Technical indicators (e.g., moving averages, RSI, MACD, average directional index, aroon oscillator, stochastic oscillator, on-balance volume, accumulation/distribution A/D line, parabolic SAR indicator, bollinger bands indicators, fibonacci, williams percent range, commodity channel index)
Machine learning features:
Feature engineering based on financial data and technical indicators
Sentiment analysis data from social media and news articles
Macroeconomic data (e.g., GDP, unemployment rate, interest rates, consumer spending, building permits, consumer confidence, inflation, producer price index, money supply, home sales, retail sales, bond yields)
Potential Applications:
Stock price prediction
Portfolio optimization
Algorithmic trading
Market sentiment analysis
Risk management
Use Cases:
Researchers investigating the effectiveness of machine learning in stock market prediction
Analysts developing quantitative trading Buy/Sell strategies
Individuals interested in building their own stock market prediction models
Students learning about machine learning and financial applications
Additional Notes:
The dataset may include different levels of granularity (e.g., daily, hourly)
Data cleaning and preprocessing are essential before model training
Regular updates are recommended to maintain the accuracy and relevance of the data
- N
Behavioural and neural characterization of optimistic reinforcement...
- neurovault.org
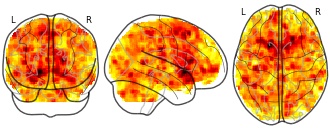
niftiUpdated Jun 30, 2018+ more versionsShareFacebookTwitterEmailClick to copy linkLink copiedCite(2018). Behavioural and neural characterization of optimistic reinforcement learning: Optimist vs. Unbiased (RPE) [Dataset]. http://identifiers.org/neurovault.image:42831niftiAvailable download formatsUnique identifierhttps://identifiers.org/neurovault.image:42831Dataset updatedJun 30, 2018LicenseCC0 1.0 Universal Public Domain Dedicationhttps://creativecommons.org/publicdomain/zero/1.0/
License information was derived automaticallyDescriptiondifference between optimist (greater learning rate for positive prediction errors) and unbiased concerning Reward prediction error representation
Collection description
Subject species
homo sapiens
Modality
fMRI-BOLD
Analysis level
group
Cognitive paradigm (task)
instrumental learning task
Map type
T
Gallup/UBS Poll # 2003-INVEST08: August, 2003 US Investor Optimism Index...
- ropercenter.cornell.edu
ascii file +1Updated Jul 22, 2008+ more versionsShareFacebookTwitterEmailClick to copy linkLink copiedCiteGallup Organization (2008). Gallup/UBS Poll # 2003-INVEST08: August, 2003 US Investor Optimism Index [Roper #31089589] [Dataset]. http://doi.org/10.25940/ROPER-31089589ascii file, spss portable fileAvailable download formatsUnique identifierhttps://doi.org/10.25940/ROPER-31089589Dataset updatedJul 22, 2008AuthorsGallup OrganizationLicensehttps://ropercenter.cornell.edu/roper-center-data-archive-terms-and-conditionshttps://ropercenter.cornell.edu/roper-center-data-archive-terms-and-conditions
Time period coveredAug 1, 2003 - Aug 14, 2003Area coveredUnited StatesMeasurement techniqueSurvey sample: National cross-section of head of households or spouse in any household with total savings and investments of $10,000 or more. Survey based on 803 telephone interviews.DescriptionCurrent employment status (2); optimistic/pessimistic about investment (2); ability to maintain/increase current income over next twelve months (1); factors that could affect investment environment over next twelve months (4); how long been investing in financial markets (1); rate of return on portfolio (2); overall rate of return for investors (2); minimum rate of return on investments (2); good time/not a good time to invest in financial markets (1); value of stock market (1); Sectors offering best investment opportunities (12); economic conditions (2); rising stock and housing prices (4).
- t
The Information's Tech Sentiment Tracker
- theinformation.com
csvUpdated Apr 9, 2025ShareFacebookTwitterEmailClick to copy linkLink copiedCiteThe Information (2025). The Information's Tech Sentiment Tracker [Dataset]. https://www.theinformation.com/projects/tech-sentiment-trackercsvAvailable download formatsDataset updatedApr 9, 2025Dataset authored and provided byThe InformationTime period covered2023 - PresentArea coveredWorldwideDataset funded byThe InformationDescriptionSince February 2023, The Information has asked readers each month whether they are more optimistic or more pessimistic about the outlook for 14 big technology companies than they were three months earlier. The results of those surveys have created a real-time record of sentiment about those companies, which we’ve compiled here. In this chart and the accompanying table, you can see the dip in confidence following the collapse of Silicon Valley Bank followed by generally rising optimism, largely around advances in artificial intelligence.
This chart shows the difference between the percentage of respondents who were optimistic about a company and the percentage who were pessimistic in each month. Click on a company, or hover over a line in the chart, to highlight that line.
This table also shows the difference between the percentage of respondents who were optimistic and the percentage who were pessimistic about the outlook for each company in each month. Click on the buttons to see the actual percentage who were optimistic or pessimistic. Each column can be sorted by the data that’s displayed. Note that the months are in reverse chronological order, with the most recent month in the first column.
VN30 Rises on Investor Optimism, Bullish Forecasts (Forecast)
- kappasignal.com
Updated Mar 14, 2025ShareFacebookTwitterEmailClick to copy linkLink copiedCiteKappaSignal (2025). VN30 Rises on Investor Optimism, Bullish Forecasts (Forecast) [Dataset]. https://www.kappasignal.com/2025/03/vn30-rises-on-investor-optimism-bullish.htmlDataset updatedMar 14, 2025Dataset authored and provided byKappaSignalLicensehttps://www.kappasignal.com/p/legal-disclaimer.htmlhttps://www.kappasignal.com/p/legal-disclaimer.html
DescriptionThis analysis presents a rigorous exploration of financial data, incorporating a diverse range of statistical features. By providing a robust foundation, it facilitates advanced research and innovative modeling techniques within the field of finance.
VN30 Rises on Investor Optimism, Bullish Forecasts
Financial data:
Historical daily stock prices (open, high, low, close, volume)
Fundamental data (e.g., market capitalization, price to earnings P/E ratio, dividend yield, earnings per share EPS, price to earnings growth, debt-to-equity ratio, price-to-book ratio, current ratio, free cash flow, projected earnings growth, return on equity, dividend payout ratio, price to sales ratio, credit rating)
Technical indicators (e.g., moving averages, RSI, MACD, average directional index, aroon oscillator, stochastic oscillator, on-balance volume, accumulation/distribution A/D line, parabolic SAR indicator, bollinger bands indicators, fibonacci, williams percent range, commodity channel index)
Machine learning features:
Feature engineering based on financial data and technical indicators
Sentiment analysis data from social media and news articles
Macroeconomic data (e.g., GDP, unemployment rate, interest rates, consumer spending, building permits, consumer confidence, inflation, producer price index, money supply, home sales, retail sales, bond yields)
Potential Applications:
Stock price prediction
Portfolio optimization
Algorithmic trading
Market sentiment analysis
Risk management
Use Cases:
Researchers investigating the effectiveness of machine learning in stock market prediction
Analysts developing quantitative trading Buy/Sell strategies
Individuals interested in building their own stock market prediction models
Students learning about machine learning and financial applications
Additional Notes:
The dataset may include different levels of granularity (e.g., daily, hourly)
Data cleaning and preprocessing are essential before model training
Regular updates are recommended to maintain the accuracy and relevance of the data
Nvidia Stock Correction: Analysts' Optimism Persists Despite Challenges -...
- indexbox.io
doc, docx, pdf, xls +1Updated Jun 1, 2025ShareFacebookTwitterEmailClick to copy linkLink copiedCiteIndexBox Inc. (2025). Nvidia Stock Correction: Analysts' Optimism Persists Despite Challenges - News and Statistics - IndexBox [Dataset]. https://www.indexbox.io/blog/nvidia-stock-faces-correction-but-analysts-remain-optimistic/doc, xls, xlsx, pdf, docxAvailable download formatsDataset updatedJun 1, 2025Dataset provided byIndexBoxAuthorsIndexBox Inc.LicenseAttribution 4.0 (CC BY 4.0)https://creativecommons.org/licenses/by/4.0/
License information was derived automaticallyTime period coveredJan 1, 2012 - Jun 1, 2025Area coveredWorldVariables measuredMarket Size, Market Share, Tariff Rates, Average Price, Export Volume, Import Volume, Demand Elasticity, Market Growth Rate, Market Segmentation, Volume of Production, and 4 moreDescriptionNvidia stock is in correction territory, yet analysts remain optimistic about its long-term prospects, maintaining high price targets despite recent challenges.
CeriBell's (CBLL) Forecast: Optimism Surrounds Future Growth Prospects....
- kappasignal.com
Updated Jun 1, 2025ShareFacebookTwitterEmailClick to copy linkLink copiedCiteKappaSignal (2025). CeriBell's (CBLL) Forecast: Optimism Surrounds Future Growth Prospects. (Forecast) [Dataset]. https://www.kappasignal.com/2025/06/ceribells-cbll-forecast-optimism.htmlDataset updatedJun 1, 2025Dataset authored and provided byKappaSignalLicensehttps://www.kappasignal.com/p/legal-disclaimer.htmlhttps://www.kappasignal.com/p/legal-disclaimer.html
DescriptionThis analysis presents a rigorous exploration of financial data, incorporating a diverse range of statistical features. By providing a robust foundation, it facilitates advanced research and innovative modeling techniques within the field of finance.
CeriBell's (CBLL) Forecast: Optimism Surrounds Future Growth Prospects.
Financial data:
Historical daily stock prices (open, high, low, close, volume)
Fundamental data (e.g., market capitalization, price to earnings P/E ratio, dividend yield, earnings per share EPS, price to earnings growth, debt-to-equity ratio, price-to-book ratio, current ratio, free cash flow, projected earnings growth, return on equity, dividend payout ratio, price to sales ratio, credit rating)
Technical indicators (e.g., moving averages, RSI, MACD, average directional index, aroon oscillator, stochastic oscillator, on-balance volume, accumulation/distribution A/D line, parabolic SAR indicator, bollinger bands indicators, fibonacci, williams percent range, commodity channel index)
Machine learning features:
Feature engineering based on financial data and technical indicators
Sentiment analysis data from social media and news articles
Macroeconomic data (e.g., GDP, unemployment rate, interest rates, consumer spending, building permits, consumer confidence, inflation, producer price index, money supply, home sales, retail sales, bond yields)
Potential Applications:
Stock price prediction
Portfolio optimization
Algorithmic trading
Market sentiment analysis
Risk management
Use Cases:
Researchers investigating the effectiveness of machine learning in stock market prediction
Analysts developing quantitative trading Buy/Sell strategies
Individuals interested in building their own stock market prediction models
Students learning about machine learning and financial applications
Additional Notes:
The dataset may include different levels of granularity (e.g., daily, hourly)
Data cleaning and preprocessing are essential before model training
Regular updates are recommended to maintain the accuracy and relevance of the data
Nikkei 225 Forecast: Optimism Fuels Bullish Outlook for the Japanese Stock...
- kappasignal.com
Updated Jun 10, 2025ShareFacebookTwitterEmailClick to copy linkLink copiedCiteKappaSignal (2025). Nikkei 225 Forecast: Optimism Fuels Bullish Outlook for the Japanese Stock Market (Forecast) [Dataset]. https://www.kappasignal.com/2025/06/nikkei-225-forecast-optimism-fuels.htmlDataset updatedJun 10, 2025Dataset authored and provided byKappaSignalLicensehttps://www.kappasignal.com/p/legal-disclaimer.htmlhttps://www.kappasignal.com/p/legal-disclaimer.html
Area coveredJapanDescriptionThis analysis presents a rigorous exploration of financial data, incorporating a diverse range of statistical features. By providing a robust foundation, it facilitates advanced research and innovative modeling techniques within the field of finance.
Nikkei 225 Forecast: Optimism Fuels Bullish Outlook for the Japanese Stock Market
Financial data:
Historical daily stock prices (open, high, low, close, volume)
Fundamental data (e.g., market capitalization, price to earnings P/E ratio, dividend yield, earnings per share EPS, price to earnings growth, debt-to-equity ratio, price-to-book ratio, current ratio, free cash flow, projected earnings growth, return on equity, dividend payout ratio, price to sales ratio, credit rating)
Technical indicators (e.g., moving averages, RSI, MACD, average directional index, aroon oscillator, stochastic oscillator, on-balance volume, accumulation/distribution A/D line, parabolic SAR indicator, bollinger bands indicators, fibonacci, williams percent range, commodity channel index)
Machine learning features:
Feature engineering based on financial data and technical indicators
Sentiment analysis data from social media and news articles
Macroeconomic data (e.g., GDP, unemployment rate, interest rates, consumer spending, building permits, consumer confidence, inflation, producer price index, money supply, home sales, retail sales, bond yields)
Potential Applications:
Stock price prediction
Portfolio optimization
Algorithmic trading
Market sentiment analysis
Risk management
Use Cases:
Researchers investigating the effectiveness of machine learning in stock market prediction
Analysts developing quantitative trading Buy/Sell strategies
Individuals interested in building their own stock market prediction models
Students learning about machine learning and financial applications
Additional Notes:
The dataset may include different levels of granularity (e.g., daily, hourly)
Data cleaning and preprocessing are essential before model training
Regular updates are recommended to maintain the accuracy and relevance of the data
FacebookTwitterUnited States Economic Optimism Index
United States Economic Optimism Index - Historical Dataset (2001-02-28/2025-07-31)
Attribution 4.0 (CC BY 4.0)https://creativecommons.org/licenses/by/4.0/
License information was derived automatically
Economic Optimism Index in the United States decreased to 48.60 points in July from 49.20 points in June of 2025. This dataset provides the latest reported value for - United States IBD/TIPP Economic Optimism Index - plus previous releases, historical high and low, short-term forecast and long-term prediction, economic calendar, survey consensus and news.