- g
NDR SDS 3D Outlines
- gimi9.com
- opendata-nstauthority.hub.arcgis.com
- +1more
Updated Jun 30, 2021+ more versions Share
Share Facebook
 Twitter
 EmailClick to copy linkLink copiedCite(2021). NDR SDS 3D Outlines [Dataset]. https://gimi9.com/dataset/uk_ndr-sds-3d-outlines1Dataset updatedJun 30, 2021Description
Survey outline information for all offshore 3D seismic surveys, including those acquired using Ocean Bottom Node and Ocean Bottom Cable techniques, as reported to BEIS OPRED in seismic survey close out reports. The NSTA did not create this data set and cannot vouch for its completeness or accuracy. Reported Seismic Data: NDR_SDS_2D_Lines Navigation information for offshore 2D seismic surveys which had Post-Stack SEG-Y data available online in the legacy NDR, the data having been reported to the NSTA via the NDR. The seismic trace data has been migrated to the current NDR service, which also holds field and pre-stack seismic data online. Seismic data may be obtained from the NDR https://ndr.nstauthority.co.uk NDR_SDS_3D_Outlines Survey outline information for offshore 3D seismic surveys, including those acquired using Ocean Bottom Node and Ocean Bottom Cable techniques, which had Post-Stack SEG-Y data available online in the legacy NDR, the data having been reported to the NSTA via the NDR. The seismic trace data has been migrated to the current NDR service, which also holds field and pre-stack seismic data online. Seismic data may be obtained from the NDR https://ndr.nstauthority.co.uk
- a
Hazard Explorer Tool Data - Earthquake (USGS National Seismic Hazard Maps)
- hub.arcgis.com
- data-napsg.opendata.arcgis.com
- +1more
Updated Jun 29, 2020ShareFacebookTwitterEmailClick to copy linkLink copiedCiteNAPSG Foundation (2020). Hazard Explorer Tool Data - Earthquake (USGS National Seismic Hazard Maps) [Dataset]. https://hub.arcgis.com/documents/4b5412e54bfa426f9c69d5d322c1aa0dDataset updatedJun 29, 2020Dataset authored and provided byNAPSG FoundationDescriptionThis link provides information and additional metadata related to the USGS National Seismic Hazard Maps. A direct shapefile download is available at https://www.sciencebase.gov/catalog/item/5db9be62e4b06957974eb5caBackground on Hazard Explorer Tool:The Hazard Explorer Tool is a web mapping application available in FEMA's Preparedness Toolkit that allows exercise planners to identify hazards that exist in their community, where their population is most vulnerable, and where their critical infrastructure/key resources are at risk.The Hazard Explorer Tool was developed under the National Exercise Program, which serves as the principal mechanism for examining the preparedness and readiness of the United States across the entire homeland security and management exercise. Communities design, coordinate, conduct, and evaluate exercises across the US as a part of their preparedness efforts.The Map Journal serves as a tool to help you identify and evaluate potential exercise scenario locations, hazard exposure, and other risk-related factors to support exercise planning. In this tool, you will identify:Which hazards exist near your location;Where your population is most vulnerable; andWhat infrastructure and resources would be most impacted in your selected scenario location.The final output of this tool is a basic PDF map of your selected scenario location, as well as links to data sources that you can share with your GIS staff to conduct more in-depth analysis for use in planning and conducting your exercise.For more information on the Hazard Explorer Tool, please visit: https://preptoolkit.fema.gov/web/hazard-explorer/hazard-explorer-tool
- l
LADPW Storm Drain System
- data.lacounty.gov
- geohub.lacity.org
- +1more
Updated Jul 23, 2014ShareFacebookTwitterEmailClick to copy linkLink copiedCiteCounty of Los Angeles (2014). LADPW Storm Drain System [Dataset]. https://data.lacounty.gov/maps/c62ae2f244f04e8086c89e8db3f530d8Dataset updatedJul 23, 2014Dataset authored and provided byCounty of Los AngelesArea coveredDescriptionThe Los Angeles County Storm Drain System shows drains, channels, catch basins, and debris basins in the County of Los Angeles using a web-based map viewer. It currently includes facilities owned and maintained by the Los Angeles County Flood Control District (District), the City of Los Angeles, and United States Army Corps of Engineers (Corps). Information on the facilities, such as date built, size, and material can be obtained by selecting them. The plans are also available for the Corps and District facilities.
- d
SWISS-2DPAGE
- dknet.org
- neuinfo.org
- +1more
Updated Jan 21, 2025ShareFacebookTwitterEmailClick to copy linkLink copiedCite(2025). SWISS-2DPAGE [Dataset]. http://identifiers.org/RRID:SCR_006946Unique identifierhttps://identifiers.org/RRID:SCR_006946Dataset updatedJan 21, 2025DescriptionA database of proteins identified by various 2-D PAGE and SDS-PAGE reference maps. Each SWISS-2DPAGE entry contains textual data on one protein, including mapping procedures, physiological and pathological information, experimental data (isoelectric point, molecular weight, amino acid composition, peptide masses) and bibliographical references. In addition to this textual data, SWISS-2DPAGE provides several 2-D PAGE and SDS-PAGE images showing the experimentally determined location of the protein, as well as a theoretical region computed from the sequence protein, indicating where the protein might be found in the gel. Using the database, users can locate these proteins on the 2-D PAGE maps or display the region of a 2-D PAGE map where one might expect to find a protein from UniProtKB/Swiss-Prot.
Soil map - Newcastle and Komakorau SD's, Waipa County
- geodata.nz
- catalogue.data.govt.nz
Updated 1935ShareFacebookTwitterEmailClick to copy linkLink copiedCiteGNS Science (1935). Soil map - Newcastle and Komakorau SD's, Waipa County [Dataset]. https://geodata.nz/geonetwork/srv/api/records/19acd666-1fc1-441a-8afd-654042ba230bwww:link-1.0-http--linkAvailable download formatsDataset updated1935Time period covered1909 - 2012Area coveredDescriptionMap on ammonia print, with annotation in pencil and ink, rich in detail, in good condition. - Observation measure: equal parts interpretation and observation. - Map size: B0. Keywords: WAIPA COUNTY; SOIL MAPS; WAIKATO RIVER; WAIPA RIVER; HAMILTON
- c
Global Land Cover Mapping and Estimation Yearly 30 m V001
- s.cnmilf.com
- cmr.earthdata.nasa.gov
- +1more
Updated Feb 25, 2025+ more versionsShareFacebookTwitterEmailClick to copy linkLink copiedCiteLP DAAC (2025). Global Land Cover Mapping and Estimation Yearly 30 m V001 [Dataset]. https://s.cnmilf.com/user74170196/https/catalog.data.gov/dataset/global-land-cover-mapping-and-estimation-yearly-30-m-v001-e4564Dataset updatedFeb 25, 2025Dataset provided byLP DAACDescriptionNASA’s Making Earth System Data Records for Use in Research Environments (MEaSUREs (https://earthdata.nasa.gov/about/competitive-programs/measures)) Global Land Cover Mapping and Estimation (GLanCE (https://sites.bu.edu/measures/)) annual 30 meter (m) Version 1 data product provides global land cover and land cover change data derived from Landsat 5 Thematic Mapper (TM), Landsat 7 Enhanced Thematic Mapper Plus (ETM+), and Landsat 8 Operational Land Imager (OLI). These maps provide the user community with land cover type, land cover change, metrics characterizing the magnitude and seasonality of greenness of each pixel, and the magnitude of change. GLanCE data products will be provided using a set of seven continental grids (https://measures-glance.github.io/glance-grids/) that use Lambert Azimuthal Equal Area projections parameterized to minimize distortion for each continent. Currently, North America, South America, Europe, and Oceania are available. This dataset is useful for a wide range of applications, including ecosystem, climate, and hydrologic modeling; monitoring the response of terrestrial ecosystems to climate change; carbon accounting; and land management. The GLanCE data product provides seven layers: the land cover class (https://sites.bu.edu/measures/project-overview/methods/), the estimated day of year of change, integer identifier for class in previous year, median and amplitude of the Enhanced Vegetation Index (EVI2) in the year, rate of change in EVI2, and the change in EVI2 median from previous year to current year. A low-resolution browse image representing EVI2 amplitude is also available for each granule. Known Issues Version 1.0 of the data set does not include Quality Assurance, Leaf Type or Leaf Phenology. These layers are populated with fill values. These layers will be included in future releases of the data product. Science Data Set (SDS) values may be missing, or of lower quality, at years when land cover change occurs. This issue is a by-product of the fact that Continuous Change Detection and Classification (CCDC) does not fit models or provide synthetic reflectance values during short periods of time between time segments. The accuracy of mapping results varies by land cover class and geography. Specifically, distinguishing between shrubs and herbaceous cover is challenging at high latitudes and in arid and semi-arid regions. Hence, the accuracy of shrub cover, herbaceous cover, and to some degree bare cover, is lower than for other classes. Due to the combined effects of large solar zenith angles, short growing seasons, lower availability of high-resolution imagery to support training data, the representation of land cover at land high latitudes in the GLanCE product is lower than in mid latitudes. Shadows and large variation in local zenith angles decrease the accuracy of the GLanCE product in regions with complex topography, especially at high latitudes. Mapping results may include artifacts from variation in data density in overlap zones between Landsat scenes relative to mapping results in non-overlap zones. Regions with low observation density due to cloud cover, especially in the tropics, and/or poor data density (e.g. Alaska, Siberia, West Africa) have lower map quality. Artifacts from the Landsat 7 Scan Line Corrector failure are occasionally evident in the GLanCE map product. High proportions of missing data in regions with snow and ice at high elevations result in missing data in the GLanCE SDSs. The GlanCE data product tends to modestly overpredict developed land cover in arid regions.
Soil map - parts of Alexandra, Hamilton and Puniu SD's, Waipa County
- geodata.nz
- catalogue.data.govt.nz
Updated 1935ShareFacebookTwitterEmailClick to copy linkLink copiedCiteGNS Science (1935). Soil map - parts of Alexandra, Hamilton and Puniu SD's, Waipa County [Dataset]. https://geodata.nz/geonetwork/srv/api/records/7a2656e7-deb0-45ec-b01f-ee2691b70554www:link-1.0-http--linkAvailable download formatsDataset updated1935Time period covered1909 - 2012Area coveredDescriptionMap on ammonia print, with annotation in pencil and ink, rich in detail, in good condition. - Observation measure: equal parts interpretation and observation. - Map size: A0. Keywords: WAIPA COUNTY; SOIL MAPS; LAKE NGAROTO; OHAUPO; PIRONGIA
- D
NSW land value and property sales web map
- data.nsw.gov.au
Updated Dec 3, 2024+ more versionsShareFacebookTwitterEmailClick to copy linkLink copiedCiteSpatial Services (DCS) (2024). NSW land value and property sales web map [Dataset]. https://www.data.nsw.gov.au/data/dataset/1-b6b5d682aa224cf582819dfcea2a3574Dataset updatedDec 3, 2024Dataset provided bySpatial Services (DCS)Area coveredNew South WalesDescriptionAll datasets except NSW land values and property sales information in this web maps are maintained by Spatial Service. Property NSW provides Land value and property Sales information. Update frequency for each dataset varies depending on the dataset. All these datasets are used in the land values and property sales map web map application.Please see individual metadata for each dataset below.Land value and property sales map can be found HERE.- For more information regarding the Land valuation and Property Sales information data please contact : valuationenquiry@property.nsw.gov.au
- For all other datasets, please contact ss-sds@customerservice.nsw.gov.au
Metadata
Content Title
NSW land value and property sales web map
Content Type
Web Map
Description
All datasets except NSW land values and property sales information in this web maps are maintained by Spatial Service. Property NSW provides Land value and property Sales information. Update frequency for each dataset varies depending on the dataset. All these datasets are used in the land values and property sales map web map application.
Please see individual metadata for each dataset below.
For more information regarding the Land valuation and Property Sales information data please contact : valuationenquiry@property.nsw.gov.au
For all other datasets, please contact ss-sds@customerservice.nsw.gov.au
Initial Publication Date
11/01/2022
Data Currency
11/01/2022
Data Update Frequency
Other
Content Source
File Type
Map Feature Service
Attribution
<span style='font-size:12.0pt; font-family:"Arial",sans-serif;
- K
Hazmat Routes
- koordinates.com
- datadiscoverystudio.org
csv, dwg, geodatabase +6Updated Aug 8, 2006+ more versionsShareFacebookTwitterEmailClick to copy linkLink copiedCiteUS Bureau of Transportation Statistics (BTS) (2006). Hazmat Routes [Dataset]. https://koordinates.com/layer/22707-hazmat-routes/pdf, kml, mapinfo mif, geodatabase, dwg, shapefile, csv, mapinfo tab, geopackage / sqliteAvailable download formatsDataset updatedAug 8, 2006Dataset authored and provided byUS Bureau of Transportation Statistics (BTS)Area coveredDescriptionThe Federal Motor Carrier Safety Administration (FMCSA) Hazardous Material Routes were developed using the 2004 First Edition TIGER/Line files. The routes are described in the National Hazardous Material Route Registry (NMHRR). The on-line NMHRR linkage is http://hazmat.fmcsa.dot.gov/nhmrr/index.asp With the exception of 13 features that were not identified with the Tiger/Lines, Hazmat routes were created by extracting the TIGER/Line segments that corresponded to each individual route. Hazmat routes in the NTAD, are organized into 3 database files, hazmat.shp, hmroutes.dbf, and hmstcnty.dbf. Each record in each database represents a unique Tiger/Line segment. These Tiger/Line segments are grouped into routes identified as character strings in the ROUTE_ID field in the hmroutes.dbf table. The route name appearing in the ROUTE_ID is assigned by FMCSA and is unique for each State [this sentence could be deleted - it doesn't add a lot to it]. The hmstcnty.dbf table allows the user to select routes by State and County. A single shapefile, called hazmat.shp, represents geometry for all routes in the United States.
© The Federal Motor Carrier Safety Administration (FMCSA) This layer is sourced from maps.bts.dot.gov.
The Federal Motor Carrier Safety Administration (FMCSA) Hazardous Material Routes (NTAD 2015) were developed using the 2004 First Edition TIGER/Line files. The routes are described in the National Hazardous Material Route Registry (NMHRR). The on-line NMHRR linkage is http://hazmat.fmcsa.dot.gov/nhmrr/index.asp With the exception of 13 features that were not identified with the Tiger/Lines, Hazmat routes were created by extracting the TIGER/Line segments that corresponded to each individual route. Hazmat routes in the NTAD, are organized into 3 database files, hazmat.shp, hmroutes.dbf, and hmstcnty.dbf. Each record in each database represents a unique Tiger/Line segment. These Tiger/Line segments are grouped into routes identified as character strings in the ROUTE_ID field in the hmroutes.dbf table. The route name appearing in the ROUTE_ID is assigned by FMCSA and is unique for each State [this sentence could be deleted - it doesn't add a lot to it]. The hmstcnty.dbf table allows the user to select routes by State and County. A single shapefile, called hazmat.shp, represents geometry for all routes in the United States.
© The Federal Motor Carrier Safety Administration (FMCSA)
- g
Map Viewing Service (WMS) of the dataset: Municipalities located on the...
- gimi9.com
Updated Feb 11, 2022ShareFacebookTwitterEmailClick to copy linkLink copiedCite(2022). Map Viewing Service (WMS) of the dataset: Municipalities located on the territory of a disadvantaged agricultural area as defined by Order of the Ministry of Agriculture and Food of 27 March 2019. | gimi9.com [Dataset]. https://gimi9.com/dataset/eu_fr-120066022-srv-51a57b3d-bef4-4fd6-b34a-37c3165b626eDataset updatedFeb 11, 2022LicenseCC0 1.0 Universal Public Domain Dedicationhttps://creativecommons.org/publicdomain/zero/1.0/
License information was derived automaticallyDescriptionMunicipalities located in disadvantaged agricultural areas as defined by Order of the Ministry of Agriculture and Food of 27 March 2019. Less-favoured agricultural areas are areas with specific (economic, agricultural, physical and demographic), natural and permanent handicaps linked to terrain, altitude, slope and soil, in which the maintenance of agricultural activity is necessary for the maintenance of the natural environment. They carry the public policy of supporting agriculture (ICHN aid) in its environmental and social functions, which make it an important contributor to the sustainable development of the economy. Compensation for natural handicaps (ICHN) contributes to the maintenance of a viable rural community in less-favoured areas and thus helps to balance the occupation of the territory by economic and human activities. There are two types of SDS: “areas subject to significant natural constraints” (SCNs) and “specific stress zones” (SSAs).
- N
Developmental differences in the brain response to unhealthy food cues: an...
- neurovault.org
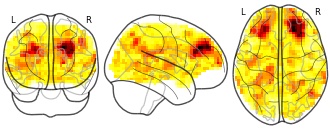
niftiUpdated Mar 1, 2021+ more versionsShareFacebookTwitterEmailClick to copy linkLink copiedCite(2021). Developmental differences in the brain response to unhealthy food cues: an fMRI study of children and adults: Correlation with SDS BMI and healthy vs unhealthy food viewing in children [Dataset]. http://identifiers.org/neurovault.image:68426niftiAvailable download formatsUnique identifierhttps://identifiers.org/neurovault.image:68426Dataset updatedMar 1, 2021LicenseCC0 1.0 Universal Public Domain Dedicationhttps://creativecommons.org/publicdomain/zero/1.0/
License information was derived automaticallyDescriptionCorrelation between standardized BMI (in kg/m2) and activation in response to healthy compared with unhealthy food viewing in children (n = 27). Corrected for age and gender.
Collection description
Food cues are omnipresent and may trigger overconsumption. In the past 2 decades, the prevalence of childhood obesity has increased dramatically. Because children's brains are still developing, especially in areas important for inhibition, children may be more susceptible than adults to tempting food cues.We examined potential developmental differences in children's and adults' responses to food cues to determine how these responses relate to weight status.We included 27 children aged 10-12 y and 32 adults aged 32-52 y. Functional magnetic resonance imaging data were acquired during a food-viewing task in which unhealthy and healthy food pictures were presented.Children had a stronger activation in the left precentral gyrus than did adults in response to unhealthy compared with healthy foods. In children, unhealthy foods elicited stronger activation in the right inferior temporal and middle occipital gyri, left precentral gyrus, bilateral opercular part of the inferior frontal gyrus, left hippocampus, and left middle frontal gyrus. Adults had stronger activation in the bilateral middle occipital gyrus and the right calcarine sulcus for unhealthy compared with healthy foods. Children with a higher body mass index (BMI) had lower activation in the bilateral dorsolateral prefrontal cortex while viewing unhealthy compared with healthy foods. In adults there was no correlation between BMI and neural response to unhealthy compared with healthy foods.Unhealthy foods might elicit more attention both in children and in adults. Children had stronger activation while viewing unhealthy compared with healthy foods in areas involved in reward, motivation, and memory. Furthermore, children activated a motivation and reward area located in the motor cortex more strongly than did adults in response to unhealthy foods. Finally, children with a higher BMI had less activation in inhibitory areas in response to unhealthy foods, which may mean they are more susceptible to tempting food cues. This trial was registered at www.trialregister.nl as NTR4255.
Subject species
homo sapiens
Modality
fMRI-BOLD
Analysis level
group
Cognitive paradigm (task)
Food viewing (passive)
Map type
T
- f
Data from: Constructing comprehensive venom proteome reference maps for...
- tandf.figshare.com
xlsxUpdated Jun 2, 2023ShareFacebookTwitterEmailClick to copy linkLink copiedCiteSusann Eichberg; Libia Sanz; Juan J Calvete; Davinia Pla (2023). Constructing comprehensive venom proteome reference maps for integrative venomics [Dataset]. http://doi.org/10.6084/m9.figshare.1568389xlsxAvailable download formatsUnique identifierhttps://doi.org/10.6084/m9.figshare.1568389Dataset updatedJun 2, 2023Dataset provided byTaylor & FrancisAuthorsSusann Eichberg; Libia Sanz; Juan J Calvete; Davinia PlaLicenseAttribution 4.0 (CC BY 4.0)https://creativecommons.org/licenses/by/4.0/
License information was derived automaticallyDescriptionObjective: Understanding the molecular basis of complex adaptive traits, such as snake venom, demands qualitative and quantitative comparisons of the temporal and spatial patterns of venom variation. Here, we assessed the proof–of-concept that locus-resolved reference venom proteome maps can be achieved through efficient pre-MS venom proteome decomplexation, peptide-centric MS/MS analysis and species-specific database searching. Methods: Venom proteome components were fractionated and quantified by RP-HPLC, SDS-PAGE and 2DE prior to LC-MS/MS matching against a species-specific transcriptomic dataset. Results: Combination of RP-HPLC/SDS-PAGE and 2DE followed by LC-MS/MS showed the existence of ∼178–180 venom protein species generated from ∼48 unique transcripts. Conclusions: Our results underscore that if sufficient pre-MS and MS efforts are applied, comprehensive venom maps can be achieved. And – equally important – dissociating the venom decomplexing steps from the protein identification process represents the key to achieving a quantitative and locus-resolved insight of the venom proteome.
- a
Waste Water Facilities
- hub.arcgis.com
Updated Nov 21, 2018+ more versionsShareFacebookTwitterEmailClick to copy linkLink copiedCiteMinnesota Pollution Control Agency (2018). Waste Water Facilities [Dataset]. https://hub.arcgis.com/maps/mpca::waste-water-facilities-2/about?layer=6Dataset updatedNov 21, 2018Dataset authored and provided byMinnesota Pollution Control AgencyArea coveredDescriptionThis map image layer displays wastewater facility locations in multiple ways. The Permit Type describes the discharge status. NPDES permits discharge to surface water while SDS permits do not. The Waste Type separates Domestic and Industrial waste. Design flow capacities are represented in million gallons/day and may not be available for all industrial facilities.Monitoring data submitted by these facilities is available through monthly Discharge Monitoring Reports.www.pca.state.mn.us/data/wastewater-data-browserwww.pca.state.mn.us/water/discharge-monitoring-reportsReST service documentation for developers
NSW Point of Interest
- data.nsw.gov.au
httpsUpdated Jan 11, 2024+ more versionsShareFacebookTwitterEmailClick to copy linkLink copiedCiteTransport for NSW (2024). NSW Point of Interest [Dataset]. https://www.data.nsw.gov.au/data/dataset/2-nsw-point-interesthttpsAvailable download formatsDataset updatedJan 11, 2024Area coveredNew South WalesDescriptionThis data is maintained by the Spatial Services Spatial Data Services. If you have any questions with regards to this dataset, please contact SS-SDS@customerservice.nsw.gov.au
The NSW Points of Interest (POI) web service allows users to search for and identify the location of features that people may want to see on a map, know about or visit. POI features are derived from features maintained within multiple themes of the NSW Foundation Data Framework (FSDF).
The features included in the NSW POI web service are: community, education, medical, recreation, transportation, utility, hydrography, physiography and place.
Click on "Go to Resource" to view the data source.

Not seeing a result you expected?
Learn how you can add new datasets to our index.
FacebookTwitterSurvey outline information for all offshore 3D seismic surveys, including those acquired using Ocean Bottom Node and Ocean Bottom Cable techniques, as reported to BEIS OPRED in seismic survey close out reports. The NSTA did not create this data set and cannot vouch for its completeness or accuracy. Reported Seismic Data: NDR_SDS_2D_Lines Navigation information for offshore 2D seismic surveys which had Post-Stack SEG-Y data available online in the legacy NDR, the data having been reported to the NSTA via the NDR. The seismic trace data has been migrated to the current NDR service, which also holds field and pre-stack seismic data online. Seismic data may be obtained from the NDR https://ndr.nstauthority.co.uk NDR_SDS_3D_Outlines Survey outline information for offshore 3D seismic surveys, including those acquired using Ocean Bottom Node and Ocean Bottom Cable techniques, which had Post-Stack SEG-Y data available online in the legacy NDR, the data having been reported to the NSTA via the NDR. The seismic trace data has been migrated to the current NDR service, which also holds field and pre-stack seismic data online. Seismic data may be obtained from the NDR https://ndr.nstauthority.co.uk