- d
Wetland Moist Soil Seed Maps for the Central Valley of California 2007-2017
- catalog.data.gov
- data.usgs.gov
- +1more
Updated Jul 6, 2024+ more versions Share
Share Facebook
 Twitter
 EmailClick to copy linkLink copiedCiteU.S. Geological Survey (2024). Wetland Moist Soil Seed Maps for the Central Valley of California 2007-2017 [Dataset]. https://catalog.data.gov/dataset/wetland-moist-soil-seed-maps-for-the-central-valley-of-california-2007-2017Dataset updatedJul 6, 2024Area coveredCalifornia, Central ValleyDescription
We produced a series of maps of moist soil seed plants within managed wetlands in the Central Valley of California from 2007-2011 & 2013-2017. Moist soil seed plants, such as swamp timothy (Crypsis schoenoides) and watergrass (Echinochloa crusgallim), are a critical food source for migratory birds. Through field observation and digitization of high resolution imagery we identified the locations of moist soil seed plants, tall emergent vegetation, water, and other land cover. Using a Support Vector Machine classification, we classified multispectral Landsat imagery from 2007-2011 and 2013-2017. We used images from April through September to create phenology metrics. The final maps show the distribution and extent of moist soil seed plants within managed wetlands in the Central Valley of California.
Ontario Tree Seed Transfer Policy data
- open.canada.ca
- catalogue.arctic-sdi.org
- +2more
csv, html, xls, zipUpdated Jun 18, 2025+ more versionsShareFacebookTwitterEmailClick to copy linkLink copiedCiteGovernment of Ontario (2025). Ontario Tree Seed Transfer Policy data [Dataset]. https://open.canada.ca/data/en/dataset/14aef4c1-40d4-40a1-ab72-bdc1a9c30fb5zip, xls, csv, htmlAvailable download formatsDataset updatedJun 18, 2025LicenseOpen Government Licence - Canada 2.0https://open.canada.ca/en/open-government-licence-canada
License information was derived automaticallyTime period coveredSep 4, 2020Area coveredOntarioDescriptionThis highly specialized publication (Ontario Tree Seed Transfer Policy data) is available in English only in accordance with Regulation 671/92, which exempts it from translation under the French Language Services Act. To obtain information in French, please contact the Ministry of Natural Resources and Forestry at (1-800-667-1940). The Ontario Tree Seed Transfer Policy ensures that seed used to regenerate forests has a good chance of producing trees that are adapted to their growing environment. It specifies where seed can be collected and used and the conditions under which seed may be transferred. The data is provided as part of Appendix 1 of the Ontario Tree Seed Transfer Policy. It is available in both table and map formats , and also includes CSV and shape files. Tabular display This dataset includes three tables that show the spatial direction of the seed transfer policy based on the climate similarity analysis (refer to Appendix 1 of the policy for information on the climate similarity analysis): * Table 1. For transitional period: Acceptable seed transfer from the 2010 Seed Zones of Ontario to current seed zones * Table 2. Acceptable seed transfer from the 2010 Seed Zones of Ontario to ecodistricts * Table 3. Acceptable seed transfer among ecodistricts Within the tables, you can click and sort by your location of interest to understand the best seed sources to collect from or deploy to. You can sort by either seed zone or ecodistrict. The policy recommends a climate similarity of 0.9 or greater to the targeted collection or deployment site. Visual display The climate similarity analysis used in developing this policy is also available as an interactive map. Maps are available to help you make seed collection and deployment decisions, including: * collecting seed by ecodistrict or county * deploying seed by ecodistrict * deploying seed by seed zone You can also view: * a detailed map of management unit by seed zone or by ecodistrict * maps to help you make seed transfer decisions related to growing season, precipitation and temperature
Data from: Seed Zone
- oregon-department-of-forestry-geo.hub.arcgis.com
Updated May 20, 2021ShareFacebookTwitterEmailClick to copy linkLink copiedCiteOregon ArcGIS Online (2021). Seed Zone [Dataset]. https://oregon-department-of-forestry-geo.hub.arcgis.com/maps/5b9ae01820314f868c5cf7015feda703Dataset updatedMay 20, 2021Dataset provided byhttps://arcgis.com/AuthorsOregon ArcGIS OnlineArea coveredDescriptionThe seed zones areas within the state that contain genetically similar trees within a species. The zones are designed to give guidance for determining appropriate tree seedling parental source area. The zones were revised in 1996. Please note that no species have been completed east of the Cascades. Lodgepole pine, black cottonwood, and ponderosa pine are also incomplete.
- a
Seed Commons Peers Map
- resiliencelink-wvu.hub.arcgis.com
Updated Jul 14, 2023ShareFacebookTwitterEmailClick to copy linkLink copiedCiteWest Virginia University (2023). Seed Commons Peers Map [Dataset]. https://resiliencelink-wvu.hub.arcgis.com/maps/WVU::seed-commons-peers-map/aboutDataset updatedJul 14, 2023Dataset authored and provided byWest Virginia UniversityArea coveredDescriptionThis layer contains the locations and websites of the peer member that contribute to Seed Commons Cooperative. Data was collected through the Seed Commons website at https://seedcommons.org/peer-members/ in 2023.
- r
NSW State Vegetation Type Map
- researchdata.edu.au
- data.nsw.gov.au
Updated Dec 15, 2023ShareFacebookTwitterEmailClick to copy linkLink copiedCitedata.nsw.gov.au (2023). NSW State Vegetation Type Map [Dataset]. https://researchdata.edu.au/nsw-state-vegetation-type-map/2838069Dataset updatedDec 15, 2023Dataset provided bydata.nsw.gov.auLicenseAttribution 4.0 (CC BY 4.0)https://creativecommons.org/licenses/by/4.0/
License information was derived automaticallyArea coveredDescriptionCurrent Extent\r \r The State Vegetation Type Map (SVTM) is a regional-scale map of NSW Plant Community Types. This map represents the current extent of each Plant Community Type, Vegetation Class and Vegetation Formation, across all tenures in NSW. This map is updated periodically as part of the Integrated BioNet Vegetation Data program to improve quality and alignment to the NSW vegetation classification hierarchy. \r \r An SVTM pre-clearing PCT map is available here .\r \r Further information about the mapping methods is available from the State Vegetation Type Mapping Program Page \r \r Current Release C2.0.M2.1 (November2024)\r \r This release includes revisions, using the most recent NSW PCT Classification Master list (represented by “C2.0” in the version release number). PCT spatial distributions were manually edited based on user and community feedback since the previous C2.0.M2.0 release. In addition, changes were made to the Native Vegetation Extent mask which is used to create the Native Extent map.\r \r Detailed technical information is available here .\r \r Data Access\r \r Map data may be downloaded, viewed within the SEED Map Viewer, or accessed via the underlying ArcGIS REST Services or WMS for integration in GIS or business applications. \r \r The Trees Near Me NSW app provides quick access to view the map using a mobile device or desktop. Download the app from Google Play or the App Store, or access the web site at https://treesnearme.app .\r \r Map Data Type\r \r The map is supplied as ESRI Feature Class (Quickview) and 5m GeoTiff Raster, and can be viewed and analysed in most commercial and open-source spatial software packages. If you prefer to use the download package, we supply an ArcGIS v10.4 mxd and/or a layer file for suggested symbology. The raster attributes contain PCT, Vegetation Class and Vegetation Formation.\r \r Feedback and Support\r \r We welcome your feedback to assist us in continuously improving our products. To help us track and process your feedback, please use the SEED Data Feedback tool available via the SEED map viewer. \r \r For further support, contact the BioNet Team at _ bionet@environment.nsw.gov.au. _\r \r Useful Related Data\r \r NSW BioNet Flora Survey Plots – PCT Reference Sites : full floristic plots used in the development of the quantitative Plant Community Type (PCT) classification. Currently available for eastern NSW PCTs version C2.0.\r \r NSW State Vegetation Type Map - technical notes \r \r Eastern NSW - percentage cleared calculation technical notes .
- f
QTLs identified for two seed traits in Precoz x L830 mapping population.
- figshare.com
- datasetcatalog.nlm.nih.gov
- +1more
xlsUpdated Jun 9, 2023ShareFacebookTwitterEmailClick to copy linkLink copiedCitePriyanka Verma; Richa Goyal; R. K. Chahota; Tilak R. Sharma; M. Z. Abdin; Sabhyata Bhatia (2023). QTLs identified for two seed traits in Precoz x L830 mapping population. [Dataset]. http://doi.org/10.1371/journal.pone.0139666.t004xlsAvailable download formatsUnique identifierhttps://doi.org/10.1371/journal.pone.0139666.t004Dataset updatedJun 9, 2023Dataset provided byPLOS ONEAuthorsPriyanka Verma; Richa Goyal; R. K. Chahota; Tilak R. Sharma; M. Z. Abdin; Sabhyata BhatiaLicenseAttribution 4.0 (CC BY 4.0)https://creativecommons.org/licenses/by/4.0/
License information was derived automaticallyDescriptionQTL: starting with “q,” followed by an abbreviation of the trait name.a: Positive values indicated additive effects contributed by the alleles of one parent (Precoz)QTLs identified for two seed traits in Precoz x L830 mapping population.
- r
NSW State Vegetation Type Map (Pre-Clearing)
- researchdata.edu.au
- data.nsw.gov.au
Updated Jun 23, 2022ShareFacebookTwitterEmailClick to copy linkLink copiedCitedata.nsw.gov.au (2022). NSW State Vegetation Type Map (Pre-Clearing) [Dataset]. https://researchdata.edu.au/nsw-state-vegetation-pre-clearing/1969361Dataset updatedJun 23, 2022Dataset provided bydata.nsw.gov.auLicenseAttribution 4.0 (CC BY 4.0)https://creativecommons.org/licenses/by/4.0/
License information was derived automaticallyArea coveredDescriptionThis Pre-Clearing map represents the pre-clearing extent of the State Vegetation Type Map (SVTM). Both SVTM and SVTM (Pre-Clearing) map each Plant Community Type, Vegetation Class and Vegetation Formation at a regional scale across all tenures in NSW. Pre-clearing PCT mapping is available for both eastern NSW and Far Western NSW. Coverage of Central NSW is a work in progress. \r \r Pre-clearing extent of PCTs was developed using a combination of aerial photographic interpretation, environmental layers and historical documents. This map is updated periodically as part of the Integrated BioNet Vegetation Data program to improve quality and alignment to the NSW vegetation classification hierarchy. \r \r Further information and technical documents about the SVTM is available from the State Vegetation Type Mapping Program Page \r \r Current Release C2.0.M2.1 (November2024)\r \r This release includes revisions, using the most recent NSW PCT Classification Masterlist (represented by “C2.0” in the version release number). PCT spatial distributions were manually edited based on user and community feedback since the previous C2.0.M2.0 release. \r \r Detailed technical information is available here .\r \r Data Access\r \r Map data may be downloaded, viewed within the SEED Map Viewer, or accessed via the underlying ArcGIS REST Services or WMS for integration in GIS or business applications. \r \r The Trees Near Me NSW app provides quick access to view the map using a mobile device or desktop. Download the app from Google Play or the App Store, or access the web site at https://treesnearme.app .\r \r Map Data Type\r \r The map is supplied as ESRI Feature Class (Quickview) and 5m GeoTiff Raster, and can be viewed and analysed in most commercial and open-source spatial software packages. If you prefer to use the download package, we supply an ArcGIS v10.6 mxd and/or a layer file for suggested symbology. The raster attributes contain PCT, Vegetation Class and Vegetation Formation.\r \r Feedback and Support\r \r We welcome your feedback to assist us in continuously improving our products. To help us track and process your feedback, please use the SEED Data Feedback tool available via the SEED map viewer or the Feedback function in Trees Near Me NSW. \r \r For further support, contact the BioNet Team at _ bionet@environment.nsw.gov.au _.\r \r Useful Related Data\r \r NSW State Vegetation Type Map : regional scale map of extant NSW Plant Community Types, Vegetation classes and Vegetation Formations.\r \r NSW BioNet Flora Survey Plots – PCT Reference Sites : full floristic plots used in the development of the quantitative Plant Community Type (PCT) classification. Currently available for eastern NSW PCTs version C2.0.\r \r NSW State Vegetation Type Map - technical notes \r \r Eastern NSW - percentage cleared technical notes .
- N
seed connectivity maps - Controls Ayahuasca: dorsal insula seed
- neurovault.org
niftiUpdated Jul 30, 2018+ more versionsShareFacebookTwitterEmailClick to copy linkLink copiedCite(2018). seed connectivity maps - Controls Ayahuasca: dorsal insula seed [Dataset]. http://identifiers.org/neurovault.image:65892niftiAvailable download formatsUnique identifierhttps://identifiers.org/neurovault.image:65892Dataset updatedJul 30, 2018LicenseCC0 1.0 Universal Public Domain Dedicationhttps://creativecommons.org/publicdomain/zero/1.0/
License information was derived automaticallyDescription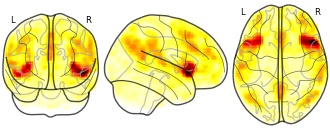
Collection description
Mean group seed connectivity maps derived from rs-fMRI data from healthy individual before and 24h after ayahuasca or placebo intake.
Subject species
homo sapiens
Modality
fMRI-BOLD
Analysis level
group
Cognitive paradigm (task)
rest eyes closed
Map type
U
- a
ESZ v2.2
- usfs.hub.arcgis.com
Updated May 21, 2020ShareFacebookTwitterEmailClick to copy linkLink copiedCiteU.S. Forest Service (2020). ESZ v2.2 [Dataset]. https://usfs.hub.arcgis.com/maps/usfs::esz-v2-2Dataset updatedMay 21, 2020Dataset authored and provided byU.S. Forest ServiceArea coveredDescriptionEastern Seed Zones map (Version 2.2). The Reforestation, Nurseries, and Genetic Resources (RNGR) team, is part of the USDA Forest Service State and Private Forestry for Region 9, Region 8, and the National Seed Laboratory. These seed zones were developed to help the National Forest System address sustainable forest management and ecosystem restoration challenges related to climate change in a uniform manner across regional and political boundaries and in a manner which encourages their adoption by state partners, the Department of Agriculture (USDA), Department of Interior (DOI), state forestry agencies, NGOs, seed producers, land managers, and other interested groups or individuals. A seed zone is defined as a region with homogenous climate and topography. Plants/trees residing within a seed zone possess, in theory, similar adaptations to local conditions.
- D
State Vegetation Type Map: Western Region v1.0. VIS_ID 4492
- data.nsw.gov.au
- researchdata.edu.au
arcgis rest service +3Updated Oct 9, 2024ShareFacebookTwitterEmailClick to copy linkLink copiedCite(2024). State Vegetation Type Map: Western Region v1.0. VIS_ID 4492 [Dataset]. https://data.nsw.gov.au/data/dataset/state-vegetation-type-map-western-region-v1-0-vis_id-4492pdf, arcgis rest service, zip, wmsAvailable download formatsDataset updatedOct 9, 2024LicenseAttribution 4.0 (CC BY 4.0)https://creativecommons.org/licenses/by/4.0/
License information was derived automaticallyDescriptionThis dataset was superseded by the State Vegetation Type Map (https://datasets.seed.nsw.gov.au/dataset/nsw-state-vegetation-type-map) on 24.06.2022.
Please note, Western Region v1.0. VIS_ID 4492 web service and zipped dataset will be archived and will no longer be available on line after 31st March 2025.
The NSW Office of Environment and Heritage (OEH) is producing a new map of the State’s native vegetation. This seamless map of NSW’s native vegetation types will enable government, industry and the community to better understand the composition and the relative significance of the native vegetation in their local area. The State Vegetation Type Map (SVTM) (http://www.environment.nsw.gov.au/vegetation/state-vegetation-type-map.htm) is constructed from the best available imagery, site survey records, and environmental information.
The primary thematic layer in this dataset is a regional scale map of Plant Community Type (PCT) - "quickview" map. This Version 1.0 release is comprehensive revision of the interim version 0.1 released in 2016.
A summary of the revisions are listed below:
- An established one-to-one relationship between PCT and Vegetation Photo Pattern (vegStruct)
Integration of existing mapping, including:
- VIS_ID 4186 - Survey and mapping of Darling floodplain vegetation communities in 2014
- Balonne mapping 2016 (VIS_ID 4453)
- Darling mapping 2016 (VIS_ID 4454
Manual revision of Vegetation Photo Pattern (VPP’s, vegStruct) with Aerial Photo Interpretation of time series enhanced time-series 2.5m SPOT 5 imagery
Reprojection of PCT models across updated VPP’s.
Manual revisions of individual PCT’s with Aerial Photo Interpretation of time series enhanced time-series 2.5m SPOT 5 imagery
Addition of the following PCT’s:
- 5: River Red Gum herbaceous-grassy very tall open forest wetland on inner floodplains in the lower slopes sub-region of the NSW South Western Slopes Bioregion and the eastern Riverina Bioregion
- 8: River Red Gum - Warrego Grass - Couch Grass riparian tall woodland wetland of the semi-arid (warm) climate zone (Riverina Bioregion and Murray Darling Depression Bioregion)
- 21: Slender Cypress Pine - Sugarwood - Western Rosewood open woodland on sandy rises mainly in the Riverina Bioregion and Murray Darling Depression Bioregion
- 44: Forb-rich Speargrass - Windmill Grass - White Top grassland of the Riverina Bioregion
- 82: Western Grey Box - Poplar Box - White Cypress Pine tall woodland on red loams mainly of the eastern Cobar Peneplain Bioregion
- 130: Horse Mulga - Umbrella Mulga shrubland on ranges in the arid and semi-arid climate zones
- 133: Western Bloodwood - Whitewood low open woodland on Tibooburra Granite
- 135: Coobah - Western Rosewood low open tall shrubland or woodland mainly on outwash areas in the Brigalow Belt South Bioregion
- 140: Broombush shrubland in dunefields of the arid climate zone
- 151: Sandhill Cane Grass hummock grassland on siliceous sands on dune crests of the arid zone
- 167: Kerosene Grass - Mulka grass - short grassland/forbland of the arid zone
- 176: Green Mallee - White Cypress Pine very tall mallee woodland on gravel rises mainly in the Cobar Peneplain Bioregion
- 181: Common Reed - Bushy Groundsel aquatic tall reedland grassland wetland of inland river systems
- 189: Ephemeral forbland wetland of low-saline lake-beds of the arid and semi-arid (warm) climate zones *190: Mallee Box open woodland mainly in the Murray Darling Depression Bioregion
- 196: Australian Boxthorn open shrubland in the semi-arid or arid climate zones
- 200: River Red Gum woodland wetland of lake fringes in the semi-arid (hot) and arid climate zones
- 205: Marsh Club-rush wetland very tall sedgeland of inland watercourses, mainly Darling Riverine Plains Bioregion
- 206: Dirty Gum - White Cypress Pine tall woodland of alluvial sand (sand monkeys) in the Darling Riverine Plains Bioregion and Brigalow Belt South Bioregion
- 208: River Red Gum low woodland of rocky gorges and creeks in the Cobar Peneplain
- 220: Purple Wood (Dead Finish) wattle shrubland of the arid zone sandplains
- 222: Low Bluebush - Bladder Saltbush open shrubland of the arid zone
- 231: Coolabah open woodland wetland dunefield depressions of the arid zone
- 240: River Coobah tall shrubland wetland of the floodplains in the Riverina Bioregion and Murray Darling Depression Bioregion
- 242: Rats Tail Couch sod grassland wetland of inland floodplains
- 250: Derived tussock grassland of the central western plains and lower slopes of NSW
- 261: Swamp Paper-bark shrubland wetland ringing depressions in the Mulga Lands Bioregion
- 264: Supplejack woodland of the NSW north-western semi-arid plains
- 359: Porcupine Grass - Red Mallee - Gum Coolabah hummock grassland / low sparse woodland on metamorphic ranges on the Barrier Range, Broken Hill Complex Bioregion
- 375: Budda Pea - Channel Millet ephemeral reedland wetland on floodplains in north-western NSW
- 630: Black Box - Silver Saltbush chenopod open woodland on terrace rises on alluvial plains in the lower Darling River and lower Murray River region of the Murray Darling Depression Bioregion
- 1203: Speargrass natural grassland of the sandplains of the Murray Darling Bioregion
QuickView map fields:
- PCTID – Plant Community Type identifier.
- PCTName – Plant Community Type common names
- vegClass – The PCT’s Keith Class
- vegFormation – The PCT’s Keith Formation
- mapSource - The source of the polygon’s PCT attribution.
- MapName – The 100k sheet map name
Note that this is a dissolved surface and does not highlight the fine internal line-work within each map unit. Please refer to the 100k full data sheets for the complete editable internal linework, available by request from the Data.Broker@environment.nsw.gov.au.
The 100K full data fields are shown below:
- polygonID – Unique map polygon identifier
- PCTID – Plant Community Type identifier.
- PCTName – Plant Community Type common names
- vegetationClass – The PCT’s Keith Class
- vegetationFormation – The PCT’s Keith Formation
mapSource - The source of the polygon’s PCT attribution. Possible values are:
- Manual editing (Aerial Photo Interpretation)
- Expert rules and manual edits
- Spatial Modelling
- Darling_vegetation_20160120
- Balonne_vegetation_20160113
- Existing Mapping VIS4186
- Site Survey (a site survey exists)
PCTIDMod1 - The most likely Plant Community Type identifier as derived from the spatial model.
PCTIDMod2 - The second most likely Plant Community Type identifier as derived from the spatial model.
PCTIDMod3 - The third most likely Plant Community Type identifier as derived from the spatial model.
vegStruct - Vegetation Structural Class as derived from initial manual aerial photo interpretation. These values may have been changed during later PCT manual editing to maintain the one-to-one relationship between PCT and Vegetation Structural Class.
Possible values for vegStruct are listed in the table below:
vegStruct (VPP) Description:
- 0 Unknown
- 1 Candidate Grasslands
- 2 Eucalyptus woodlands
- 3 Casuarina woodlands
- 4 Cypress Pine woodlands
- 5 Floodplain forest
- 6 Non woody wetlands
- 7 Brigalow
- 8 Mulga
- 9 Chenopods
- 10 Myall woodlands
- 11 Riparian woody
- 12 Acacia Tall Shrublands >2m
- 13 Tall Shrublands >2m
- 14 Lignum
- 15 Mallee
- 16 Nitre wetlands and floodways
- 17 Hopbush
- 18 Leopard wood
- 19 Low shrublands <2m
PCTmapAccuracyConfidence - Modelling Confidence for PCTIDMod1 – Note that this reflects the modelling surface (PCTIDMod1) only and may not reflect the confidence of the mapped attribution (PCTID). PCTallocationConfidence can only be accurately applied to the published map surface (PCTID) where mapSource = ‘Spatial Modelling’.
PCTSiteValidation - Type of field validation used to assess PCT reliability:
Possible Values are:
- Not validated
- RPD (Rapid)
- Full floristic validation
Full details will be provided in the pending Technical Report.
VIS_ID 4492
Data from: QTL mapping and transcriptome analysis of seed germination under...
- agdatacommons.nal.usda.gov
binUpdated Mar 11, 2025ShareFacebookTwitterEmailClick to copy linkLink copiedCiteUnited States Department of Agriculture (2025). QTL mapping and transcriptome analysis of seed germination under PEG-induced water stress in Lactuca spp. [Dataset]. https://agdatacommons.nal.usda.gov/articles/dataset/QTL_mapping_and_transcriptome_analysis_of_seed_germination_under_PEG-induced_water_stress_in_Lactuca_spp_/27887103binAvailable download formatsDataset updatedMar 11, 2025AuthorsUnited States Department of AgricultureLicensehttps://rightsstatements.org/vocab/UND/1.0/https://rightsstatements.org/vocab/UND/1.0/
DescriptionFor RNA-Seq and network analyses, US96UC23 (L. serriola) was assessed in the control (dH2O) and treatment (10% PEG) groups, with 15 replicates in each group. Thirty seeds were used in each replicate. All germinated seeds (RE > 5 mm) of US96UC23 were collected from each replicate in the control and treatment groups after 4 days as the post-germination stage. The total RNA (5 µg) of each replicate was extracted from the bulk seed sample, including all seed parts. The number of DEGs was 4,095. The top 20 GO terms and KEGG pathways were assessed by enrichment analysis. The consensus network analysis captured 44 modules. The top 20 gene networks in 10 significant modules were constructed to identify hub genes in each dataset. The manuscript was published in the Scientific Reports journal (https://doi.org/10.1038/s41598-024-77972-9).
- d
Seed collection sites on Mauna Kea, Hawaii 2014-2015
- catalog.data.gov
- dataone.org
- +2more
Updated Jul 6, 2024+ more versionsShareFacebookTwitterEmailClick to copy linkLink copiedCiteU.S. Geological Survey (2024). Seed collection sites on Mauna Kea, Hawaii 2014-2015 [Dataset]. https://catalog.data.gov/dataset/seed-collection-sites-on-mauna-kea-hawaii-2014-2015Dataset updatedJul 6, 2024Area coveredHawaii, Mauna KeaDescriptionThis data set provides the date and location of seeds collected for germination and planting as part of the larger experiment in the technical report, "Facilitating Adaptation in Montane Plants to Changing Precipitation along an Elevation Gradient." The species name provided is the Hawaiian name, with the scientific name provided in the column description. The rest of the date is date and time, with elevation and land management area names. Data are provided in shapefile format (.shp) and can be used with ESRI or other spatial mapping software.
- a
ESZ v1.0
- usfs.hub.arcgis.com
Updated Jul 26, 2018ShareFacebookTwitterEmailClick to copy linkLink copiedCiteU.S. Forest Service (2018). ESZ v1.0 [Dataset]. https://usfs.hub.arcgis.com/maps/usfs::esz-v1-0Dataset updatedJul 26, 2018Dataset authored and provided byU.S. Forest ServiceArea coveredDescriptionA map service for draft Eastern Seed Zones.
- D
NSW Bionet Vegetation Map Data Collection
- data.nsw.gov.au
- researchdata.edu.au
- +1more
pdf, zipUpdated Feb 26, 2024ShareFacebookTwitterEmailClick to copy linkLink copiedCiteNSW Department of Climate Change, Energy, the Environment and Water (2024). NSW Bionet Vegetation Map Data Collection [Dataset]. https://data.nsw.gov.au/data/dataset/d613a3e3-63c6-4fb1-bfa8-b068b5b16182zip, pdfAvailable download formatsDataset updatedFeb 26, 2024Dataset provided byDepartment of Climate Change, Energy, the Environment and Water of New South Waleshttps://www.nsw.gov.au/departments-and-agencies/dcceewLicenseAttribution 4.0 (CC BY 4.0)https://creativecommons.org/licenses/by/4.0/
License information was derived automaticallyArea coveredNew South WalesDescriptionThe BioNet Vegetation Map Data Collection is a catalogue of all available NSW vegetation type maps including Standardised products from the State vegetation Type Mapping Program, and non-standardised historic and contemporary maps. Each map stored in the catalogue is assigned a unique VIS (Vegetation Information System) identification number. This map catalogue contains:
- geographical information system (GIS) data;
- metadata, including technical reports;
- images of cartographic map products; and
- web map services, where available.
For more information see http://www.environment.nsw.gov.au/research/VISmap.htm. There are over 680 native vegetation type maps available.
All vegetation maps in this collection are available as individual data records in the SEED environmental data portal. For GIS data downloads for these individual vegetation maps go to the individual record in SEED. A combined map footprint layer can be downloaded here as a resource from this metadata record to assist GIS users in selecting maps. This footprint layer will eventually be removed once all individual vegetation maps in SEED have individual web map services created allowing them to be viewed in the SEED map viewer.
The data collection includes State Vegetation Type Maps produced by the State Vegetation Type Mapping Program. For more detail on the Program see http://www.environment.nsw.gov.au/vegetation/state-vegetation-type-map.htm . You can search for maps produced under this Program by entering the search term "SVTM" in to the SEED search window.
- a
Forest Reproductive Materials Seed Stands & Seed Orchards
- data-forestry.opendata.arcgis.com
Updated Mar 19, 2025ShareFacebookTwitterEmailClick to copy linkLink copiedCitemapping.geodata_forestry (2025). Forest Reproductive Materials Seed Stands & Seed Orchards [Dataset]. https://data-forestry.opendata.arcgis.com/datasets/cd81412fc6204f6d96f04e8893e37fe6Dataset updatedMar 19, 2025Dataset authored and provided bymapping.geodata_forestryArea coveredDescriptionThe Categories are: "Source Identified" comes from general or specific locations within a single region of provenance or seed zone altitude band in which no specific superior qualities are recognised. "Selected" are collected from stands showing superior characteristics, e.g. better form, growth rate and health. "Qualified" derives from the selection of superior individual trees which have not undergone any form of testing. "Tested" derives from the selection of individual trees or stands that have undergone evaluation for genetic quality or have been shown to be superior, in comparison to accepted standards.
- f
Additional file 6: Table S2. of Genome-wide SNP identification, linkage map...
- datasetcatalog.nlm.nih.gov
- springernature.figshare.com
Updated Feb 14, 2017ShareFacebookTwitterEmailClick to copy linkLink copiedCiteCheng, Peng; Grusak, Michael; McGee, Rebecca; Ma, Yu; Coyne, Clarice; Main, Dorrie; Mazourek, Michael (2017). Additional file 6: Table S2. of Genome-wide SNP identification, linkage map construction and QTL mapping for seed mineral concentrations and contents in pea (Pisum sativum L.) [Dataset]. https://datasetcatalog.nlm.nih.gov/dataset?q=0001785608Dataset updatedFeb 14, 2017AuthorsCheng, Peng; Grusak, Michael; McGee, Rebecca; Ma, Yu; Coyne, Clarice; Main, Dorrie; Mazourek, MichaelDescriptionLinkage map. This file contains the details of the linkage map. (XLSX 38 kb)
Details of loci associated with seed coat color identified via association...
- plos.figshare.com
xlsUpdated Jun 10, 2023ShareFacebookTwitterEmailClick to copy linkLink copiedCiteJian Song; Zhangxiong Liu; Huilong Hong; Yansong Ma; Long Tian; Xinxiu Li; Ying-Hui Li; Rongxia Guan; Yong Guo; Li-Juan Qiu (2023). Details of loci associated with seed coat color identified via association mapping. [Dataset]. http://doi.org/10.1371/journal.pone.0159064.t002xlsAvailable download formatsUnique identifierhttps://doi.org/10.1371/journal.pone.0159064.t002Dataset updatedJun 10, 2023AuthorsJian Song; Zhangxiong Liu; Huilong Hong; Yansong Ma; Long Tian; Xinxiu Li; Ying-Hui Li; Rongxia Guan; Yong Guo; Li-Juan QiuLicenseAttribution 4.0 (CC BY 4.0)https://creativecommons.org/licenses/by/4.0/
License information was derived automaticallyDescriptionDetails of loci associated with seed coat color identified via association mapping.
- D
Data from: Soil and Land Information
- data.nsw.gov.au
- researchdata.edu.au
- +1more
html, pdf +1Updated Mar 13, 2024ShareFacebookTwitterEmailClick to copy linkLink copiedCiteNSW Department of Climate Change, Energy, the Environment and Water (2024). Soil and Land Information [Dataset]. https://data.nsw.gov.au/data/dataset/soil-and-land-informationpdf, html, spatial viewerAvailable download formatsDataset updatedMar 13, 2024Dataset provided byDepartment of Climate Change, Energy, the Environment and Water of New South Waleshttps://www.nsw.gov.au/departments-and-agencies/dcceewLicenseAttribution 4.0 (CC BY 4.0)https://creativecommons.org/licenses/by/4.0/
License information was derived automaticallyDescriptionStatewide soil and land information can be discovered and viewed through eSPADE or SEED. Datasets include soil profiles, soil landscapes, soil and land resources, acid sulfate soil risk mapping, hydrogeological landscapes, land systems and land use. There are also various statewide coverages of specific soil and land characteristics, such as soil type, land and soil capability, soil fertility, soil regolith, soil hydrology and modelled soil properties.
Both eSPADE and SEED enable soil and land data to be viewed on a map. SEED focuses more on the holistic approach by enabling you to add other environmental layers such as mining boundaries, vegetation or water monitoring points. SEED also provides access to metadata and data quality statements for layers.
eSPADE provides greater functions and allows you to drill down into soil points or maps to access detailed information such as reports and images. You can navigate to a specific location, then search and select multiple objects and access detailed information about them. You can also export spatial information for use in other applications such as Google Earth™ and GIS software.
eSPADE is a free Internet information system and works on desktop computers, laptops and mobile devices such as smartphones and tablets and uses a Google maps-based platform familiar to most users. It has over 42,000 soil profile descriptions and approximately 4,000 soil landscape descriptions. This includes the maps and descriptions from the Soil Landscape Mapping program. eSPADE also includes the base maps underpinning Biophysical Strategic Agricultural Land (BSAL).
For more information on eSPADE visit: https://www.environment.nsw.gov.au/topics/land-and-soil/soil-data/espade
- f
Additional file 1: Table S1. of Genome-wide SNP identification, linkage map...
- datasetcatalog.nlm.nih.gov
- springernature.figshare.com
Updated Feb 14, 2017ShareFacebookTwitterEmailClick to copy linkLink copiedCiteMazourek, Michael; Main, Dorrie; Ma, Yu; McGee, Rebecca; Cheng, Peng; Coyne, Clarice; Grusak, Michael (2017). Additional file 1: Table S1. of Genome-wide SNP identification, linkage map construction and QTL mapping for seed mineral concentrations and contents in pea (Pisum sativum L.) [Dataset]. https://datasetcatalog.nlm.nih.gov/dataset?q=0001785552Dataset updatedFeb 14, 2017AuthorsMazourek, Michael; Main, Dorrie; Ma, Yu; McGee, Rebecca; Cheng, Peng; Coyne, Clarice; Grusak, MichaelDescriptionInformation of the polymorphic markers previously published. This file contains the primer information of the polymorphic SNP markers, SSR markers and eIF4E allele specific marker. (XLSX 16 kb)
NSW soil profiles
- researchdata.edu.au
- data.nsw.gov.au
- +1more
Updated Sep 6, 2018+ more versionsShareFacebookTwitterEmailClick to copy linkLink copiedCitedata.nsw.gov.au (2018). NSW soil profiles [Dataset]. https://researchdata.edu.au/nsw-soil-profiles/1343043Dataset updatedSep 6, 2018LicenseAttribution 4.0 (CC BY 4.0)https://creativecommons.org/licenses/by/4.0/
License information was derived automaticallyArea coveredDescriptionStatewide dataset of soil profiles, comprising (at time of writing) ~73,000 separate observations of soil physical and chemical characteristics, along with (in most cases) information about the landscape in which they occur (including landform, geology, vegetation, hydrology, land use and land degradation). Data is added by both NSW Government agencies and members of the wider NSW community using standardised Soil Data Cards, an internet application called eDIRT and is stored in the NSW Soil and Land Information System (SALIS).\r \r Online Maps: Part of this area is also covered by other soil mapping products, see the soil map index in eSPADE . eSPADE contains a suite of soil and landscape information including soil profile data. Many of these datasets have hot-linked soil reports. An alternative viewer is the SEED Map ; an ideal way to see what other natural resources datasets (e.g. vegetation) are available for this map area.\r \r Reference: NSW Soil and Land Information System (SALIS) database, NSW Office of Environment and Heritage, MSQL 2012, accessed {insert date of access}.
FacebookTwitterWe produced a series of maps of moist soil seed plants within managed wetlands in the Central Valley of California from 2007-2011 & 2013-2017. Moist soil seed plants, such as swamp timothy (Crypsis schoenoides) and watergrass (Echinochloa crusgallim), are a critical food source for migratory birds. Through field observation and digitization of high resolution imagery we identified the locations of moist soil seed plants, tall emergent vegetation, water, and other land cover. Using a Support Vector Machine classification, we classified multispectral Landsat imagery from 2007-2011 and 2013-2017. We used images from April through September to create phenology metrics. The final maps show the distribution and extent of moist soil seed plants within managed wetlands in the Central Valley of California.