- N
Sugar Map MKDADensity Meta Analysis: included : 2025-06-16 18:13:46
- neurovault.org
zipUpdated Jun 16, 2025 Share
Share Facebook
 Twitter
 EmailClick to copy linkLink copiedCite(2025). Sugar Map MKDADensity Meta Analysis: included : 2025-06-16 18:13:46 [Dataset]. http://identifiers.org/neurovault.collection:20919zipAvailable download formatsUnique identifierhttps://identifiers.org/neurovault.collection:20919Dataset updatedJun 16, 2025License
CC0 1.0 Universal Public Domain Dedicationhttps://creativecommons.org/publicdomain/zero/1.0/
License information was derived automaticallyDescriptionA collection of 5 brain maps. Each brain map is a 3D array of values representing properties of the brain at different locations.
Collection description
MKDADensity meta analysis with FDRCorrector
- Z
Data from: Mapping sugarcane globally at 10 m resolution using GEDI and...
- data.niaid.nih.gov
- zenodo.org
Updated Sep 5, 2024ShareFacebookTwitterEmailClick to copy linkLink copiedCiteStrey, Rob (2024). Mapping sugarcane globally at 10 m resolution using GEDI and Sentinel-2 [Dataset]. https://data.niaid.nih.gov/resources?id=zenodo_10871163Dataset updatedSep 5, 2024Dataset provided byDi Tommaso, Stefania
Lobell, David
Wang, Sherrie
Strey, RobLicenseAttribution 4.0 (CC BY 4.0)https://creativecommons.org/licenses/by/4.0/
License information was derived automaticallyDescriptionDataset Abstract:Sugarcane is an important source of food, biofuel, and farmer income in many countries. At the same time, sugarcane is implicated in many social and environmental challenges, including water scarcity and nutrient pollution. Currently, few of the top sugar-producing countries generate reliable maps of where sugarcane is cultivated. To fill this gap, we introduce a dataset of detailed sugarcane maps for the top 13 producing countries in the world, comprising nearly 90% of global production. Maps were generated for the 2019-2022 period by combining data from the Global Ecosystem Dynamics Investigation (GEDI) and Sentinel-2 (S2). GEDI data were used to provide training data on where tall and short crops were growing each month, while S2 features were used to map tall crops for all cropland pixels each month. Sugarcane was then identified by leveraging the fact that sugar is typically the only tall crop growing for a substantial fraction of time during the study period. Comparisons with field data, pre-existing maps, and official government statistics all indicated high precision and recall of our maps. Agreement with field data at the pixel level exceeded 80% in most countries, and sub-national sugarcane areas from our maps were consistent with government statistics. Exceptions appeared mainly due to problems in underlying cropland masks, or to under-reporting of sugarcane area by governments. The final maps should be useful in studying the various impacts of sugarcane cultivation and producing maps of related outcomes such as sugarcane yields.
USAGE: Users must mask the provided sugarcane map with the most appropriate crop mask from the ones provided. If none of the provided crop masks are suitable, users can use an external crop mask instead.
Validation results for the sugarcane maps are detailed in Section 4.3 of the paper. For Indonesia and Guatemala, no field-level data or raster datasets were available for validation of our sugarcane maps.
Dataset: 5 bandsb1: Number of tall monthsb2: Sugarcane Map: 0 = non-sugarcane, 1 = sugarcaneb3: ESA crop mask: 0 = non-cropland, 1 = croplandb4: ESRI crop mask: 0 = non-cropland, 1 = croplandb5: GLAD crop mask: 0 = non-cropland, 1 = cropland
The dataset can be accessed on Google Earth Engine (GEE) at https://code.earthengine.google.com/?asset=projects/lobell-lab/gedi_sugarcane/maps/imgColl_10m_ESAESRIGLADExample GEE script for visualizing and masking the sugarcane maps by country available at:https://code.earthengine.google.com/545a87ce9bc29f2b5ad180955d974f8c?asset=projects%2fl Bell-lab%2Fgedi_sugarcane%2 Maps%2FimgColl_10m_ESAESRIGLAD
- N
Sugar Map MKDADensity Meta Analysis: included : 2025-06-16 18:13:46:...
- neurovault.org
niftiUpdated Jun 16, 2025+ more versionsShareFacebookTwitterEmailClick to copy linkLink copiedCite(2025). Sugar Map MKDADensity Meta Analysis: included : 2025-06-16 18:13:46: p_corr-FDR_method-indep.nii.gz [Dataset]. http://identifiers.org/neurovault.image:901368niftiAvailable download formatsUnique identifierhttps://identifiers.org/neurovault.image:901368Dataset updatedJun 16, 2025LicenseCC0 1.0 Universal Public Domain Dedicationhttps://creativecommons.org/publicdomain/zero/1.0/
License information was derived automaticallyDescription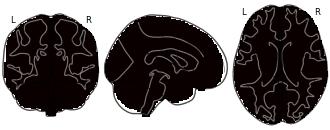
Collection description
MKDADensity meta analysis with FDRCorrector
Subject species
homo sapiens
Modality
Other
Analysis level
meta-analysis
Map type
P
- a
ETJ
- city-of-sugar-land-hub-cosl.hub.arcgis.com
- data.sugarlandtx.gov
- +2more
Updated Oct 16, 2017ShareFacebookTwitterEmailClick to copy linkLink copiedCiteCity of Sugar Land AGO (2017). ETJ [Dataset]. https://city-of-sugar-land-hub-cosl.hub.arcgis.com/maps/COSL::etjDataset updatedOct 16, 2017Dataset authored and provided byCity of Sugar Land AGOArea coveredDescriptionCity Limits and ETJ
- O
Sugar mills - Queensland
- data.qld.gov.au
rest +3Updated Dec 17, 2024ShareFacebookTwitterEmailClick to copy linkLink copiedCitePrimary Industries (2024). Sugar mills - Queensland [Dataset]. https://www.data.qld.gov.au/dataset/sugar-mills-queenslandwms(1 KiB), rest(1 KiB), shp, tab, fgdb, kmz, gpkg(1 MiB), xml(1 KiB)Available download formatsDataset updatedDec 17, 2024Dataset authored and provided byPrimary IndustriesLicenseAttribution 4.0 (CC BY 4.0)https://creativecommons.org/licenses/by/4.0/
License information was derived automaticallyArea coveredQueenslandDescriptionThis dataset shows the location of sugar mills in Queensland.This dataset can be viewed in the web map AgTrends Spatial: https://qldspatial.information.qld.gov.au/AGTrendsSpatial/
- g
Tobacco, Sugar Beets | gimi9.com
- gimi9.com
Updated Aug 10, 2004ShareFacebookTwitterEmailClick to copy linkLink copiedCite(2004). Tobacco, Sugar Beets | gimi9.com [Dataset]. https://gimi9.com/dataset/ca_8235b6ab-95de-5f30-b9fb-6ce4263d6e00/Dataset updatedAug 10, 2004DescriptionContained within the 4th Edition (1974) of the Atlas of Canada is a set of four maps. These maps show the size and extent as of 1961 of seeded acres, by census division, for tobacco, sugar beets and soybeans. Each map is accompanied by a supplementary text giving the total area for Canada, the provinces and the territories. The oilseeds map shows the combined value of farm sales for 1960 to 1961 for flax, soybean, sunflower, rape, mustard and safflower crops.
- d
ScienceBase Item Summary Page
- datadiscoverystudio.org
+ more versionsShareFacebookTwitterEmailClick to copy linkLink copiedCiteU.S. Geological Survey, ScienceBase Item Summary Page [Dataset]. http://datadiscoverystudio.org/geoportal/rest/metadata/item/52777171434e46af924301debac9d71b/htmlArea coveredDescriptionLink to the ScienceBase Item Summary page for the item described by this metadata record. Service Protocol: Link to the ScienceBase Item Summary page for the item described by this metadata record. Application Profile: Web Browser. Link Function: information
- a
107 sugar maple spp
- azgeo-open-data-agic.hub.arcgis.com
- azgeo-data-hub-agic.hub.arcgis.com
Updated Dec 21, 2016+ more versionsShareFacebookTwitterEmailClick to copy linkLink copiedCiteU.S. Forest Service (2016). 107 sugar maple spp [Dataset]. https://azgeo-open-data-agic.hub.arcgis.com/items/22b840f1b6cb4d56a9009d6ee2884667Dataset updatedDec 21, 2016Dataset authored and provided byU.S. Forest ServiceArea coveredDescriptionFIA Modeled Abundance depicts current species abundance and distribution across the contiguous United States, modeled by using FIA field plot data. Although the absolute values associated with the maps differ from species to species, the highest values within each map are always associated with darker colors.
The Little's Range Boundaries show the historical tree species ranges across North America. This is a digital representation of maps by Elbert L. Little, Jr., published between 1971 and 1977. These maps were based on botanical lists, forest surveys, field notes and herbarium specimens.
- d
ScienceBase Item Summary Page
- datadiscoverystudio.org
pdfUpdated Apr 6, 2013ShareFacebookTwitterEmailClick to copy linkLink copiedCiteU.S. Geological Survey (2013). ScienceBase Item Summary Page [Dataset]. http://datadiscoverystudio.org/geoportal/rest/metadata/item/bbe569893dbe4eae86237294a007d186/htmlpdfAvailable download formatsDataset updatedApr 6, 2013Area coveredDescriptionLink to the ScienceBase Item Summary page for the item described by this metadata record. Service Protocol: Link to the ScienceBase Item Summary page for the item described by this metadata record. Application Profile: Web Browser. Link Function: information
- d
USGS US Topo 7.5-minute map for Sugar Grove, IL 2012
- datadiscoverystudio.org
geopdfUpdated Aug 9, 2012+ more versionsShareFacebookTwitterEmailClick to copy linkLink copiedCiteU.S. Geological Survey (2012). USGS US Topo 7.5-minute map for Sugar Grove, IL 2012 [Dataset]. http://datadiscoverystudio.org/geoportal/rest/metadata/item/2530170922fe4b0097f586c4e720e351/htmlgeopdf(19.460463)Available download formatsDataset updatedAug 9, 2012Area coveredDescriptionLayered GeoPDF 7.5 Minute Quadrangle Map. Layers of geospatial data include orthoimagery, roads, grids, geographic names, elevation contours, hydrography, and other selected map features.
- a
CityLimits and ETJ
- city-of-sugar-land-hub-cosl.hub.arcgis.com
- data.sugarlandtx.gov
- +1more
Updated Oct 16, 2017ShareFacebookTwitterEmailClick to copy linkLink copiedCiteCity of Sugar Land AGO (2017). CityLimits and ETJ [Dataset]. https://city-of-sugar-land-hub-cosl.hub.arcgis.com/maps/de8642f70a6640fa8f0ec67d59f8b4b8Dataset updatedOct 16, 2017Dataset authored and provided byCity of Sugar Land AGOArea coveredDescriptionCity Limits and ETJ
Global import data of Sugar
- volza.com
csvUpdated Jun 27, 2025+ more versionsShareFacebookTwitterEmailClick to copy linkLink copiedCiteVolza FZ LLC (2025). Global import data of Sugar [Dataset]. https://www.volza.com/p/sugar/import/import-in-reunion/csvAvailable download formatsDataset updatedJun 27, 2025Dataset provided byVolzaAuthorsVolza FZ LLCLicenseAttribution 4.0 (CC BY 4.0)https://creativecommons.org/licenses/by/4.0/
License information was derived automaticallyVariables measuredCount of importers, Sum of import value, 2014-01-01/2021-09-30, Count of import shipmentsDescription213 Global import shipment records of Sugar with prices, volume & current Buyer's suppliers relationships based on actual Global export trade database.
Tobacco, Sugar Beets
- data.wu.ac.at
- open.canada.ca
jpg, pdfUpdated May 26, 2017+ more versionsShareFacebookTwitterEmailClick to copy linkLink copiedCiteNatural Resources Canada | Ressources naturelles Canada (2017). Tobacco, Sugar Beets [Dataset]. https://data.wu.ac.at/schema/www_data_gc_ca/ODIzNWI2YWItOTVkZS01ZjMwLWI5ZmItNmNlNDI2M2Q2ZTAwjpg, pdfAvailable download formatsDataset updatedMay 26, 2017LicenseOpen Government Licence - Canada 2.0https://open.canada.ca/en/open-government-licence-canada
License information was derived automaticallyArea covered71ea0c85957d4a26232d4e83771e85506ff63e31DescriptionContained within the 4th Edition (1974) of the Atlas of Canada is a set of four maps. These maps show the size and extent as of 1961 of seeded acres, by census division, for tobacco, sugar beets and soybeans. Each map is accompanied by a supplementary text giving the total area for Canada, the provinces and the territories. The oilseeds map shows the combined value of farm sales for 1960 to 1961 for flax, soybean, sunflower, rape, mustard and safflower crops.
Data from: Banana and sugar cane plots, Guadeloupe Island, 1969
- dataverse.cirad.fr
7z +2Updated Dec 15, 2023+ more versionsShareFacebookTwitterEmailClick to copy linkLink copiedCiteAnnelise Tran; Annelise Tran; Vincent Bonnal; Vincent Bonnal; Philippe Cattan; Philippe Cattan; Pascal Degenne; Pascal Degenne; Victor Dufleit; Victor Dufleit (2023). Banana and sugar cane plots, Guadeloupe Island, 1969 [Dataset]. http://doi.org/10.18167/DVN1/GCOYQDtiff(180463736), tiff(122918418), tiff(133531454), tiff(77983548), tiff(188517878), 7z(6420812), tiff(198904430), tiff(193424344), tiff(166049968), tiff(193296334), tiff(168736530), tiff(174442568), tiff(128949598), tiff(193726618), tiff(234572098), tiff(193503806), tiff(198288366), tiff(111744488), tiff(175839834), tiff(130910758), tiff(200263218), tiff(165552776), tiff(234902794), 7z(1838280), tiff(208923428), tiff(184460938), application/x-gzip(2046), tiff(220808221), tiff(164132146), tiff(197031074), tiff(205228780), tiff(209594270), tiff(219757696)Available download formatsUnique identifierhttps://doi.org/10.18167/DVN1/GCOYQDDataset updatedDec 15, 2023Dataset provided byCentre de coopération internationale en recherche agronomique pour le développementhttps://www.cirad.fr/AuthorsAnnelise Tran; Annelise Tran; Vincent Bonnal; Vincent Bonnal; Philippe Cattan; Philippe Cattan; Pascal Degenne; Pascal Degenne; Victor Dufleit; Victor DufleitLicenseAttribution 4.0 (CC BY 4.0)https://creativecommons.org/licenses/by/4.0/
License information was derived automaticallyTime period coveredJan 1, 1969 - Dec 31, 1969Area coveredGuadeloupeDescriptionA map of banana and sugarcane plots was produced from scanned paper maps of Guadeloupe in 1969 published by the French National Geographic Institute. Paper maps have been digitized and georeferenced to be integrated into a Geographic Information System environment. Then, vectorization tools have been used to convert the scanned images (TIF format) into vector-based feature layers (shapefile format) (software: ESRI ArcMap and ArcScan Extension, Redlands, CA, USA). Une carte des parcelles de culture de banane et de canne à sucre a été produite à partir de cartes papier scannées de la Guadeloupe en 1969 publiées par l'Institut National Géographique. Les cartes papiers ont été scannées et géoréférencées pour être intégrées dans un Système d'Information Géographique. Des outils de numérisation ont ensuite été utilisés pour convertir les images scannées (format TIF) en couches vectorielles (format shapefile) (logiciel : ESRI ArcMap and ArcScan Extension, Redlands, CA, USA).
- f
amino sugar & nucleotide sugar metabolism-html
- figshare.com
htmlUpdated Jan 18, 2016ShareFacebookTwitterEmailClick to copy linkLink copiedCiteKaren Fugate (2016). amino sugar & nucleotide sugar metabolism-html [Dataset]. http://doi.org/10.6084/m9.figshare.930560.v1htmlAvailable download formatsUnique identifierhttps://doi.org/10.6084/m9.figshare.930560.v1Dataset updatedJan 18, 2016Dataset provided byfigshareAuthorsKaren FugateLicenseAttribution 4.0 (CC BY 4.0)https://creativecommons.org/licenses/by/4.0/
License information was derived automaticallyDescriptionunigenes associated with amino sugar & nucleotide sugar metabolism
- d
USGS US Topo 7.5-minute map for Sugar Lake, PA 2010
- datadiscoverystudio.org
geopdfUpdated Jun 30, 2010ShareFacebookTwitterEmailClick to copy linkLink copiedCiteU.S. Geological Survey (2010). USGS US Topo 7.5-minute map for Sugar Lake, PA 2010 [Dataset]. http://datadiscoverystudio.org/geoportal/rest/metadata/item/4b8a86c2862c410aaf0d0b1ef0cc70c5/htmlgeopdf(16.522427)Available download formatsDataset updatedJun 30, 2010Area coveredDescriptionLayered GeoPDF 7.5 Minute Quadrangle Map. Layers of geospatial data include orthoimagery, roads, grids, geographic names, elevation contours, hydrography, and other selected map features.
- a
New England Climate Change Exposure Mapping
- femc-uvm.hub.arcgis.com
Updated Jan 31, 2023ShareFacebookTwitterEmailClick to copy linkLink copiedCitevmc@uvm.edu_UVM (2023). New England Climate Change Exposure Mapping [Dataset]. https://femc-uvm.hub.arcgis.com/items/338c5cdfbb844c4b9ea109a1e8de987aDataset updatedJan 31, 2023Dataset authored and provided byvmc@uvm.edu_UVMArea coveredNew EnglandDescriptionThe uncertainty around the impacts of changing climate poses a significant challenge to sustaining forest ecosystems in the Northeast. Important work has been done downscaling projected changes in climate conditions, modeling shifts in suitable habitat, and mapping disturbance patterns across the region. The goal of this project is to aggregate these valuable but disparate spatial data sets to quantify relative exposure to climate change impacts at the species, and community level. The resulting climate exposure maps provide insight to how the degree of potential risk exposure vary across the landscape an across species. Results indicate that at the stand level, highest overall exposure to climate, disturbance, and limitations in suitable habitat for current species distributions occurs in mountainous regions throughout the region and southeastern Maine. Across the region relative exposure increases by 4 percent between low and high emission scenarios. Much of our current management is guided by the outcomes of decades of silviculture research, yet many of the conditions under which those results were generated are rapidly changing. These relative exposure maps can inform where climate adaptation management applications may be most necessary over time.
- o
Location map of land proposed for economic land concession by Kampong Speu...
- data.opendevelopmentmekong.net
Updated Jan 11, 2016ShareFacebookTwitterEmailClick to copy linkLink copiedCite(2016). Location map of land proposed for economic land concession by Kampong Speu Sugar Group Co., Ltd [Dataset]. https://data.opendevelopmentmekong.net/dataset/location-map-of-land-proposed-for-economic-land-concession-by-kampong-speu-sugar-group-co-ltdDataset updatedJan 11, 2016LicenseAttribution 4.0 (CC BY 4.0)https://creativecommons.org/licenses/by/4.0/
License information was derived automaticallyArea coveredKampong Speu ProvinceDescriptionA map showing the location of the economic land concession proposed by Kampong Speu Sugar Group Co., Ltd in Oaral Wildlife Sanctuary in Kampong Speu.
- O
OBTAINING BETTER INFORMATION FOR PLANNING IN THE SUGAR LANDS: A PROJECT...
- data.qld.gov.au
Updated May 8, 2023ShareFacebookTwitterEmailClick to copy linkLink copiedCiteGeological Survey of Queensland (2023). OBTAINING BETTER INFORMATION FOR PLANNING IN THE SUGAR LANDS: A PROJECT DEVELOPING A STATEWIDE INTEGRATED SPATIAL DATA INFRASTRUCTURE FOR QUEENSLAND`S SUGAR GROWING LANDS. - 34 MAPS [Dataset]. https://www.data.qld.gov.au/dataset/cr042407Dataset updatedMay 8, 2023Dataset authored and provided byGeological Survey of QueenslandLicenseAttribution 4.0 (CC BY 4.0)https://creativecommons.org/licenses/by/4.0/
License information was derived automaticallyArea coveredQueenslandDescriptionURL: https://geoscience.data.qld.gov.au/dataset/cr042407
OBTAINING BETTER INFORMATION FOR PLANNING IN THE SUGAR LANDS: A PROJECT DEVELOPING A STATEWIDE INTEGRATED SPATIAL DATA INFRASTRUCTURE FOR QUEENSLAND`S SUGAR GROWING LANDS. - 34 MAPS
- S
Fire Department Coverage Map
- data.sugarlandtx.gov
- city-of-sugar-land-hub-cosl.hub.arcgis.com
Updated Jun 5, 2023ShareFacebookTwitterEmailClick to copy linkLink copiedCiteGIS (2023). Fire Department Coverage Map [Dataset]. https://data.sugarlandtx.gov/dataset/fire-department-coverage-maphtml, arcgis geoservices rest apiAvailable download formatsDataset updatedJun 5, 2023Dataset provided byCity of Sugar Land AGOAuthorsGISDescriptionCity map showing the location of each fire station along with their service areas or districts. Service areas include both in city limits as well as within the extra territorial jurisdiction.
FacebookTwitterCC0 1.0 Universal Public Domain Dedicationhttps://creativecommons.org/publicdomain/zero/1.0/
License information was derived automatically
A collection of 5 brain maps. Each brain map is a 3D array of values representing properties of the brain at different locations.
Collection description
MKDADensity meta analysis with FDRCorrector