Motor-Imagery EEG Dataset During Robot-Arm Control
- zenodo.org
- data.niaid.nih.gov
bin, zipUpdated Apr 24, 2025 Share
Share Facebook
 Twitter
 EmailClick to copy linkLink copiedCiteAndrea Farabbi; Andrea Farabbi; Fabiola Ghiringhelli; Luca Mainardi; Luca Mainardi; Joao Miguel Sanches; Joao Miguel Sanches; Plinio Moreno; Plinio Moreno; José Santos-Victor; José Santos-Victor; Patricia Figueiredo; Patricia Figueiredo; Athanasios Vourvopoulos; Athanasios Vourvopoulos; Fabiola Ghiringhelli (2025). Motor-Imagery EEG Dataset During Robot-Arm Control [Dataset]. http://doi.org/10.5281/zenodo.5882500zip, binAvailable download formatsUnique identifierhttps://doi.org/10.5281/zenodo.5882500Dataset updatedApr 24, 2025AuthorsAndrea Farabbi; Andrea Farabbi; Fabiola Ghiringhelli; Luca Mainardi; Luca Mainardi; Joao Miguel Sanches; Joao Miguel Sanches; Plinio Moreno; Plinio Moreno; José Santos-Victor; José Santos-Victor; Patricia Figueiredo; Patricia Figueiredo; Athanasios Vourvopoulos; Athanasios Vourvopoulos; Fabiola GhiringhelliLicense
Attribution 4.0 (CC BY 4.0)https://creativecommons.org/licenses/by/4.0/
License information was derived automaticallyDescriptionExperiment Description:
This experiment involved 12 healthy subjects with no prior experience on neurofeedback or BCI, and without any known neurological disorders. All participants are right-handed, except one ambidextrous (participant #5). All participants have provided their signed informed consent for participating in the study in accordance with the 1964 Declaration of Helsinki.
The experiment had been conducted in a laboratory environment under controlled conditions. The subjects went through three sessions lasting maximum two hours, during three consecutive days and each day at approximately at the same hour.
During each session, participants underwent three different conditions. The first condition was always the ”resting-state”: the user was asked to keep the eyes open for two minutes staring at a screen with a green cross and a red arrow pointing up, and then closed for the other two minutes. After this, two more conditions followed related to a Motor Imagery (MI) task performed in a randomized order between left|right-hand movement. The two MI conditions consisted of two phases each: a training phase and a test phase. The general experimental routine for both of them was the same: each trial lasted 6 seconds (2 seconds baseline and 4 seconds MI), forewarned by the appearance of a green cross on the screen and a concomitant beep-sound a second before the onset of the task.
Then, an arrow was appearing pointing left or right, and the subject had to imagine the movement of the corresponding arm reaching an object in front of the Baxter Robot (Rethink Robotics, Bochum, Germany). For both phases, 20 trials from left and 20 trials for right MI were generated in a randomized order, for a total of 40 trials. Finally, there was an inter-trial interval that extended randomly between 1.5 and 3.5 seconds.
Overall, this study resulted into 180 EEG datasets.
Data Description:
Data Format General Data Format (GDF) Sampling Rate 250 Hz Channels 32 EEG + 3 ACC. EEG system LiveAmp 32 with active electrodes actiCAP (Brain Products GmbH, Gilching, Germany) Events:
Code Description 32775 Baseline Start 32776 Baseline Stop 768 Start of Trial, Trigger at t=0s 786 Cross on screen (BCI experiment) 33282 Beep 769 class1, Left hand - cue onset 770 class2, Right hand - cue onset 781 Feedback (continuous) - onset 800 End Of Trial 1010 End Of Session 33281 Train 32770 Experiment Stop Directory Tree:
ROOT
| chanlocs.locs
|
|
+--- USER #
| +---SESSION #
| | +---CONDITION #
| | | \---RESTING_STATE
| | | +---1st_PERSON
| | | | TRAINING
| | | | ONLINE
| | | +---3rd_PERSON
| | | | TRAINING
| | | | ONLINEBrain Tumor MRI Multi-Class Dataset
- kaggle.com
Updated May 11, 2025ShareFacebookTwitterEmailClick to copy linkLink copiedCiteMaxwell Bernard (2025). Brain Tumor MRI Multi-Class Dataset [Dataset]. https://www.kaggle.com/datasets/maxwellbernard/brain-tumor-mri-multi-class-datasetCroissantCroissant is a format for machine-learning datasets. Learn more about this at mlcommons.org/croissant.Dataset updatedMay 11, 2025AuthorsMaxwell BernardLicenseAttribution-ShareAlike 4.0 (CC BY-SA 4.0)https://creativecommons.org/licenses/by-sa/4.0/
License information was derived automaticallyDescriptionThis dataset consolidates brain tumor MRI images from multiple Kaggle data sources to create a larger, centralised dataset for research and model development purposes.
The dataset comprises of 16,269 images containing four main classes : - Glioma (3,325 Images) - Meningioma (3,266 Images) - Pituitary (2,974 Images) - Healthy (6,704 Images)
Key Notes:
Duplicate images are likely due to dataset overlaps when sourcing. We strongly recommend users perform deduplication before training.
The dataset does not apply any cleaning, resizing, or augmentation — it's intended to be raw and inclusive for flexibility.
Recommendation:
This dataset is ideal for users who want to experiment with preprocessing, augmentation, and custom cleaning pipelines on a real-world, mixed-quality dataset. Please consult medical professionals if using this data for clinical or diagnostic applications.
File Structure
The dataset is organised as follows: - Each folder represents the 4 classes - The filenames of each image contain the original dataset source (Name based on user who published the dataset to Kaggle)
Data Sources:
This dataset combines the following five Kaggle datasets:
- Brain Tumors Dataset (Excluded their augmented images) by Seyed Mohammad Hossein Hashemi
- PMRAM Bangladeshi Brain Cancer MRI Dataset by Orville
- Brain Tumor MRI Images (17 Classes) by Fernando Feltrin (Only T1 glioma/meningioma/healthy images used).
- SIAR Dataset by Masoumeh Siar (Only healthy scans used as this was a binary dataset, and did not differentiate the tumor types).
- Brain Tumor MRI Scans by Rajarshi Mandal
These datasets were selected for their popularity, quality, and complementary class coverage. We recommend checking the original sources for more information about data collection methods and original licensing.
License
This combined dataset is released under CC BY-SA 4.0 to comply with ShareAlike requirements of source datasets:
Source Dataset Original License Brain Tumors Dataset CC0 Brain Tumor MRI Scans CC0 SIAR Dataset Unkown. Requires citation in publications. PMRAM Bangladeshi Brain Cancer MRI Dataset CC BY-SA 4.0 Brain Tumor MRI Images (17 Classes) ODbL 1.0 Resting State MRI data from healthy control (HC), Parkinson's disease with...
- openneuro.org
Updated Jan 28, 2025ShareFacebookTwitterEmailClick to copy linkLink copiedCiteAaron S. Kemp; Journey Eubank; Yahya Younus; James E. Galvin; Fred W. Prior; Linda J. Larson-Prior (2025). Resting State MRI data from healthy control (HC), Parkinson's disease with normal cognition (PD-NC), and Parkinson's disease with mild cognitive impairment (PD-MCI) cohorts [Dataset]. http://doi.org/10.18112/openneuro.ds005892.v1.0.0Unique identifierhttps://doi.org/10.18112/openneuro.ds005892.v1.0.0Dataset updatedJan 28, 2025AuthorsAaron S. Kemp; Journey Eubank; Yahya Younus; James E. Galvin; Fred W. Prior; Linda J. Larson-PriorLicenseCC0 1.0 Universal Public Domain Dedicationhttps://creativecommons.org/publicdomain/zero/1.0/
License information was derived automaticallyDescriptionDataset Description
This dataset is part of a longitudinal study investigating Parkinson's Disease (PD) and its associated cognitive impairments. Resting-state fMRI data were collected from participants, including healthy controls (HC) and Parkinson's Disease patients with normal cognition (PD-NC) or mild cognitive impairment (PD-MCI). The dataset is organized following the Brain Imaging Data Structure (BIDS) specifications.
License
This dataset is shared under the CC0 1.0 Universal (CC0 1.0) Public Domain Dedication. Please acknowledge this dataset in publications by citing it appropriately.
Study Information
- Title: Resting State MRI data from healthy control (HC), Parkinson's disease with normal cognition (PD-NC), and Parkinson's disease with mild cognitive impairment (PD-MCI) cohorts
- Principal Investigator: James E. Galvin
- Ethics Approval: This study was approved by the Institutional Review Board (IRB) at New York University (NYU). All participants provided informed consent.
Data Acquisition
MRI Details
- Scanner Manufacturer: Siemens
- Model: TrioTim
- Magnetic Field Strength: 3 Tesla
- Sequence: Echo Planar Imaging (EPI)
- Repetition Time (TR): 2000 ms
- Echo Time (TE): 29 ms
- Flip Angle: 90°
- Slice Thickness: 3.5 mm
- Spacing Between Slices: 3.5 mm
Dataset Structure
The dataset contains the following main directories and files:
/participants.json: Contains metadata describing participant demographics and group information./sub-<label>/: Subdirectories for each participant containing:anat/: Anatomical MRI data (T1-weighted images).func/: Functional MRI data (resting-state).
Key Files
participants.tsvA tab-separated file containing participant demographics, group, and other relevant information.
participant_id group age sex sub-MJF001 PD-MCI 68 M sub-MJF008 HC 61 F task-rest_bold.jsonMetadata file describing the resting-state functional MRI task. Key fields include: - TaskName: "rest" - Modality: "MR" - TR: 2000 ms - EchoTime: 29 ms
Usage Notes
- Please refer to the associated publication for detailed study design and analysis pipelines.
Acknowledgments
We acknowledge the contributions of all study participants and research team members. Special thanks to the Micheal J. Fox Foundation for supporting this research.
SynthRAD2023 Grand Challenge dataset: synthetizing computed tomography for...
- zenodo.org
pdf, zipUpdated Jul 15, 2024+ more versionsShareFacebookTwitterEmailClick to copy linkLink copiedCiteAdrian Thummerer; Adrian Thummerer; Erik van der Bijl; Erik van der Bijl; Matteo Maspero; Matteo Maspero (2024). SynthRAD2023 Grand Challenge dataset: synthetizing computed tomography for radiotherapy [Dataset]. http://doi.org/10.5281/zenodo.7260705zip, pdfAvailable download formatsUnique identifierhttps://doi.org/10.5281/zenodo.7260705Dataset updatedJul 15, 2024AuthorsAdrian Thummerer; Adrian Thummerer; Erik van der Bijl; Erik van der Bijl; Matteo Maspero; Matteo MasperoLicenseAttribution-NonCommercial 4.0 (CC BY-NC 4.0)https://creativecommons.org/licenses/by-nc/4.0/
License information was derived automaticallyDescriptionDATASET STRUCTURE
The dataset can be downloaded from https://doi.org/10.5281/zenodo.7260705 and a detailed description is offered at "synthRAD2023_dataset_description.pdf".
The training datasets for Task1 is in Task1.zip, while for Task2 in Task2.zip. After unzipping, each Task is organized according to the following folder structure:
Task1.zip/
├── Task1
├── brain
├── 1Bxxxx
├── mr.nii.gz
├── ct.nii.gz
└── mask.nii.gz
├── ...
└── overview
├── 1_brain_train.xlsx
├── 1Bxxxx_train.png
└── ...
└── pelvis
├── 1Pxxxx
├── mr.nii.gz
├── ct.nii.gz
├── mask.nii.gz
├── ...
└── overview
├── 1_pelvis_train.xlsx
├── 1Pxxxx_train.png
└── ....
Task2.zip/
├──Task2
├── brain
├── 2Bxxxx
├── cbct.nii.gz
├── ct.nii.gz
└── mask.nii.gz
├── ...
└── overview
├── 2_brain_train.xlsx
├── 2Bxxxx_train.png
└── ...
└── pelvis
├── 2Pxxxx
├── cbct.nii.gz
├── ct.nii.gz
├── mask.nii.gz
├── ...
└── overview
├── 2_pelvis_train.xlsx
├── 2Pxxxx_train.png
└── ....
Each patient folder has a unique name that contains information about the task, anatomy, center and a patient ID. The naming follows the convention below:
[Task] [Anatomy] [Center] [PatientID]
1 B A 001
In each patient folder, three files can be found:
-
ct.nii.gz: CT image
-
mr.nii.gz or cbct.nii.gz (depending on the task): CBCT/MR image
-
mask.nii.gz:image containing a binary mask of the dilated patient outline
For each task and anatomy, an overview folder is provided which contains the following files:
-
[task]_[anatomy]_train.xlsx: This file contains information about the image acquisition protocol for each patient.
-
[task][anatomy][center][PatientID]_train.png: For each patient a png showing axial, coronal and sagittal slices of CBCT/MR, CT, mask and the difference between CBCT/MR and CT is provided. These images are meant to provide a quick visual overview of the data.
DATASET DESCRIPTION
This challenge dataset contains imaging data of patients who underwent radiotherapy in the brain or pelvis region. Overall, the population is predominantly adult and no gender restrictions were considered during data collection. For Task 1, the inclusion criteria were the acquisition of a CT and MRI during treatment planning while for task 2, acquisitions of a CT and CBCT, used for patient positioning, were required. Datasets for task 1 and 2 do not necessarily contain the same patients, given the different image acquisitions for the different tasks.
Data was collected at 3 Dutch university medical centers:
-
Radboud University Medical Center
-
University Medical Center Utrecht
-
University Medical Center Groningen
For anonymization purposes, from here on, institution names are substituted with A, B and C, without specifying which institute each letter refers to.
The following number of patients is available in the training set.
Training
Brain
Pelvis
Center A
Center B
Center C
Total
Center A
Center B
Center C
Total
Task 1
60
60
60
180
120
0
60
180
Task 2
60
60
60
180
60
60
60
180
Each subset generally contains equal amounts of patients from each center, except for task 1 brain, where center B had no MR scans available. To compensate for this, center A provided twice the number of patients than in other subsets.
Validation
Brain
Pelvis
Center A
Center B
Center C
Total
Center A
Center B
Center C
Total
Task 1
10
10
10
30
20
0
10
30
Task 2
10
10
10
30
10
10
10
30
Testing
Brain
Pelvis
Center A
Center B
Center C
Total
Center A
Center B
Center C
Total
Task 1
20
20
20
60
40
0
20
60
Task 2
20
20
20
60
20
20
20
60
In total, for all tasks and anatomies combined, 1080 image pairs (720 training, 120 validation, 240 testing) are available in this dataset. This repository only contains the training data.
All images were acquired with the clinically used scanners and imaging protocols of the respective centers and reflect typical images found in clinical routine. As a result, imaging protocols and scanner can vary between patients. A detailed description of the imaging protocol for each image, can be found in spreadsheets that are part of the dataset release (see dataset structure).
Data was acquired with the following scanners:
-
Center A:
-
MRI: Philips Ingenia 1.5T/3.0T
-
CT: Philips Brilliance Big Bore or Siemens Biograph20 PET-CT
-
CBCT: Elekta XVI
-
-
Center B:
-
MRI: Siemens MAGNETOM Aera 1.5T or MAGNETOM Avanto_fit 1.5T
-
CT: Siemens SOMATOM Definition AS
-
CBCT: IBA Proteus+ or Elekta XVI
-
-
Center C:
-
MRI: Siemens Avanto fit 1.5T or Siemens MAGNETOM Vida fit 3.0T
-
CT: Philips Brilliance Big Bore
-
CBCT: Elekta XVI
-
For task 1, MRIs were acquired with a T1-weighted gradient echo or an inversion prepared - turbo field echo (TFE) sequence and collected along with the corresponding planning CTs for all subjects. The exact acquisition parameters vary between patients and centers. For centers B and C, selected MRIs were acquired with Gadolinium contrast, while the selected MRIs of center A were acquired without contrast.
For task 2, the CBCTs used for image-guided radiotherapy ensuring accurate patient position were selected for all subjects along with the corresponding
BIDS Phenotype External Example Dataset
- openneuro.org
Updated Jun 4, 2022ShareFacebookTwitterEmailClick to copy linkLink copiedCiteSamuel Guay; Eric Earl; Hao-Ting Wang; Remi Gau; Dorota Jarecka; David Keator; Melissa Kline Struhl; Satra Ghosh; Louis De Beaumont; Adam G. Thomas (2022). BIDS Phenotype External Example Dataset [Dataset]. http://doi.org/10.18112/openneuro.ds004131.v1.0.1Unique identifierhttps://doi.org/10.18112/openneuro.ds004131.v1.0.1Dataset updatedJun 4, 2022AuthorsSamuel Guay; Eric Earl; Hao-Ting Wang; Remi Gau; Dorota Jarecka; David Keator; Melissa Kline Struhl; Satra Ghosh; Louis De Beaumont; Adam G. ThomasLicenseCC0 1.0 Universal Public Domain Dedicationhttps://creativecommons.org/publicdomain/zero/1.0/
License information was derived automaticallyDescriptionBIDS Phenotype External Dataset Example COPY OF "The NIMH Healthy Research Volunteer Dataset" (ds003982)
Modality-agnostic files were copied over and the
CHANGESfile was updated.THE ORIGINAL DATASET ds003982 README FOLLOWS
A comprehensive clinical, MRI, and MEG collection characterizing healthy research volunteers collected at the National Institute of Mental Health (NIMH) Intramural Research Program (IRP) in Bethesda, Maryland using medical and mental health assessments, diagnostic and dimensional measures of mental health, cognitive and neuropsychological functioning, structural and functional magnetic resonance imaging (MRI), along with diffusion tensor imaging (DTI), and a comprehensive magnetoencephalography battery (MEG).
In addition, blood samples are currently banked for future genetic analysis. All data collected in this protocol are broadly shared in the OpenNeuro repository, in the Brain Imaging Data Structure (BIDS) format. In addition, blood samples of healthy volunteers are banked for future analyses. All data collected in this protocol are broadly shared here, in the Brain Imaging Data Structure (BIDS) format. In addition, task paradigms and basic pre-processing scripts are shared on GitHub. This dataset is unique in its depth of characterization of a healthy population in terms of brain health and will contribute to a wide array of secondary investigations of non-clinical and clinical research questions.
This dataset is licensed under the Creative Commons Zero (CC0) v1.0 License.
Recruitment
Inclusion criteria for the study require that participants are adults at or over 18 years of age in good health with the ability to read, speak, understand, and provide consent in English. All participants provided electronic informed consent for online screening and written informed consent for all other procedures. Exclusion criteria include:
- A history of significant or unstable medical or mental health condition requiring treatment
- Current self-injury, suicidal thoughts or behavior
- Current illicit drug use by history or urine drug screen
- Abnormal physical exam or laboratory result at the time of in-person assessment
- Less than an 8th grade education or IQ below 70
- Current employees, or first-degree relatives of NIMH employees
Study participants are recruited through direct mailings, bulletin boards and listservs, outreach exhibits, print advertisements, and electronic media.
Clinical Measures
All potential volunteers first visit the study website (https://nimhresearchvolunteer.ctss.nih.gov), check a box indicating consent, and complete preliminary self-report screening questionnaires. The study website is HIPAA compliant and therefore does not collect PII ; instead, participants are instructed to contact the study team to provide their identity and contact information. The questionnaires include demographics, clinical history including medications, disability status (WHODAS 2.0), mental health symptoms (modified DSM-5 Self-Rated Level 1 Cross-Cutting Symptom Measure), substance use survey (DSM-5 Level 2), alcohol use (AUDIT), handedness (Edinburgh Handedness Inventory), and perceived health ratings. At the conclusion of the questionnaires, participants are again prompted to send an email to the study team. Survey results, supplemented by NIH medical records review (if present), are reviewed by the study team, who determine if the participant is likely eligible for the protocol. These participants are then scheduled for an in-person assessment. Follow-up phone screenings were also used to determine if participants were eligible for in-person screening.
In-person Assessments
At this visit, participants undergo a comprehensive clinical evaluation to determine final eligibility to be included as a healthy research volunteer. The mental health evaluation consists of a psychiatric diagnostic interview (Structured Clinical Interview for DSM-5 Disorders (SCID-5), along with self-report surveys of mood (Beck Depression Inventory-II (BD-II) and anxiety (Beck Anxiety Inventory, BAI) symptoms. An intelligence quotient (IQ) estimation is determined with the Kaufman Brief Intelligence Test, Second Edition (KBIT-2). The KBIT-2 is a brief (20-30 minute) assessment of intellectual functioning administered by a trained examiner. There are three subtests, including verbal knowledge, riddles, and matrices.
Medical Evaluation
Medical evaluation includes medical history elicitation and systematic review of systems. Biological and physiological measures include vital signs (blood pressure, pulse), as well as weight, height, and BMI. Blood and urine samples are taken and a complete blood count, acute care panel, hepatic panel, thyroid stimulating hormone, viral markers (HCV, HBV, HIV), C-reactive protein, creatine kinase, urine drug screen and urine pregnancy tests are performed. In addition, blood samples that can be used for future genomic analysis, development of lymphoblastic cell lines or other biomarker measures are collected and banked with the NIMH Repository and Genomics Resource (Infinity BiologiX). The Family Interview for Genetic Studies (FIGS) was later added to the assessment in order to provide better pedigree information; the Adverse Childhood Events (ACEs) survey was also added to better characterize potential risk factors for psychopathology. The entirety of the in-person assessment not only collects information relevant for eligibility determination, but it also provides a comprehensive set of standardized clinical measures of volunteer health that can be used for secondary research.
MRI Scan
Participants are given the option to consent for a magnetic resonance imaging (MRI) scan, which can serve as a baseline clinical scan to determine normative brain structure, and also as a research scan with the addition of functional sequences (resting state and diffusion tensor imaging). The MR protocol used was initially based on the ADNI-3 basic protocol, but was later modified to include portions of the ABCD protocol in the following manner:
- The T1 scan from ADNI3 was replaced by the T1 scan from the ABCD protocol.
- The Axial T2 2D FLAIR acquisition from ADNI2 was added, and fat saturation turned on.
- Fat saturation was turned on for the pCASL acquisition.
- The high-resolution in-plane hippocampal 2D T2 scan was removed and replaced with the whole brain 3D T2 scan from the ABCD protocol (which is resolution and bandwidth matched to the T1 scan).
- The slice-select gradient reversal method was turned on for DTI acquisition, and reconstruction interpolation turned off.
- Scans for distortion correction were added (reversed-blip scans for DTI and resting state scans).
- The 3D FLAIR sequence was made optional and replaced by one where the prescription and other acquisition parameters provide resolution and geometric correspondence between the T1 and T2 scans.
At the time of the MRI scan, volunteers are administered a subset of tasks from the NIH Toolbox Cognition Battery. The four tasks include:
- Flanker inhibitory control and attention task assesses the constructs of attention and executive functioning.
- Executive functioning is also assessed using a dimensional change card sort test.
- Episodic memory is evaluated using a picture sequence memory test.
- Working memory is evaluated using a list sorting test.
MEG
An optional MEG study was added to the protocol approximately one year after the study was initiated, thus there are relatively fewer MEG recordings in comparison to the MRI dataset. MEG studies are performed on a 275 channel CTF MEG system (CTF MEG, Coquiltam BC, Canada). The position of the head was localized at the beginning and end of each recording using three fiducial coils. These coils were placed 1.5 cm above the nasion, and at each ear, 1.5 cm from the tragus on a line between the tragus and the outer canthus of the eye. For 48 participants (as of 2/1/2022), photographs were taken of the three coils and used to mark the points on the T1 weighted structural MRI scan for co-registration. For the remainder of the participants (n=16 as of 2/1/2022), a Brainsight neuronavigation system (Rogue Research, Montréal, Québec, Canada) was used to coregister the MRI and fiducial localizer coils in realtime prior to MEG data acquisition.
Specific Measures within Dataset
Online and In-person behavioral and clinical measures, along with the corresponding phenotype file name, sorted first by measurement location and then by file name.
Location Measure File Name Online Alcohol Use Disorders Identification Test (AUDIT) audit Demographics demographics DSM-5 Level 2 Substance Use - Adult drug_use Edinburgh Handedness Inventory (EHI) ehi Health History Form health_history_questions Perceived Health Rating - self health_rating DSM-5 Self-Rated Level 1 Cross-Cutting Symptoms Measure – Adult (modified) mental_health_questions World Health Organization Disability Assessment Schedule Data for: Adaptive P300-Based Brain-Computer Interface for Attention...
- zenodo.org
- data.niaid.nih.gov
zipUpdated Oct 1, 2024ShareFacebookTwitterEmailClick to copy linkLink copiedCiteSandra-Carina Noble; Sandra-Carina Noble; Eva Woods; Eva Woods; Tomas Ward; Tomas Ward; John V Ringwood; John V Ringwood (2024). Data for: Adaptive P300-Based Brain-Computer Interface for Attention Training [Dataset]. http://doi.org/10.5281/zenodo.8183397zipAvailable download formatsUnique identifierhttps://doi.org/10.5281/zenodo.8183397Dataset updatedOct 1, 2024AuthorsSandra-Carina Noble; Sandra-Carina Noble; Eva Woods; Eva Woods; Tomas Ward; Tomas Ward; John V Ringwood; John V RingwoodLicenseAttribution 4.0 (CC BY 4.0)https://creativecommons.org/licenses/by/4.0/
License information was derived automaticallyDescriptionThe dataset contains EEG and behavioral data of 47 participants who completed 9 runs (i.e. copy-spelled 9 words) in a P300 speller task, as well as a random dot motion (RDM) task and questionnaires in a single experimental session. Details of the experimental protocol can be found here:
Noble SC, Woods E, Ward T, Ringwood JV. “Adaptive P300-Based Brain-Computer Interface for Attention Training: Protocol for a Randomized Controlled Trial.” JMIR Res Protoc 2023, 12:e46135, doi: 10.2196/46135
A journal article describing the results of the study can be found here:
Noble SC, Woods E, Ward T, Ringwood JV. “Accelerating P300-Based Neurofeedback Training for Attention Enhancement Using Iterative Learning Control: A Randomised Controlled Trial.” J Neural Eng 2024, 21(2), doi: 10.1088/1741-2552/ad2c9ePlease cite the results paper when using the data.
Each participant folder contains:
- [xxx]-raw.[xxx] – unprocessed EEG signals (in mV) from 32 electrodes for all 9 P300 speller runs in Openvibe (.ov) and Matlab (.mat) file formats, see details of the runs below
- [xxx]-processed.[xxx] – contains 3 xDAWN components extracted by the xDAWN spatial filter according to the weights in “spatial-filter.cfg”
- classifier.cfg - LDA classifier weights
- spatial-filter.cfg - xDAWN spatial filter weights
- log.txt - contains the group assignment, start and end time of the experiment, and performance in the P300 speller and RDM tasks
The file “Subject Information.csv” contains the age and gender of all participants.
The file “Questionnaire scores.csv” contains the responses to the questionnaire described in the experimental protocol and the NASA Task Load Index (TLX) for all participants.
The .ov and .mat files contain data from the following runs:
Filename Word to be copy-spelled Number of flashes per row and column Feedback given to participant calibration-signal1 THE 12 no calibration-signal2 QUICK 12 no calibration-signals Concatenation of calibration-signal1 and calibration-signal2 eval DOG 12 yes training-run-1 BEAUTIFUL 10 yes training-run-2 to training-run-5 BEAUTIFUL varying yes post-training-run DANCE 12 yes This research is supported by the Irish Research Council under project ID GOIPG/2020/692 and Science Foundation Ireland under grant number 12/RC/2289_P2.
BIDS Phenotype Aggregation Example Dataset
- openneuro.org
Updated Jun 4, 2022+ more versionsShareFacebookTwitterEmailClick to copy linkLink copiedCiteSamuel Guay; Eric Earl; Hao-Ting Wang; Remi Gau; Dorota Jarecka; David Keator; Melissa Kline Struhl; Satra Ghosh; Louis De Beaumont; Adam G. Thomas (2022). BIDS Phenotype Aggregation Example Dataset [Dataset]. http://doi.org/10.18112/openneuro.ds004130.v1.0.0Unique identifierhttps://doi.org/10.18112/openneuro.ds004130.v1.0.0Dataset updatedJun 4, 2022AuthorsSamuel Guay; Eric Earl; Hao-Ting Wang; Remi Gau; Dorota Jarecka; David Keator; Melissa Kline Struhl; Satra Ghosh; Louis De Beaumont; Adam G. ThomasLicenseCC0 1.0 Universal Public Domain Dedicationhttps://creativecommons.org/publicdomain/zero/1.0/
License information was derived automaticallyDescriptionBIDS Phenotype Aggregation Example COPY OF "The NIMH Healthy Research Volunteer Dataset" (ds003982)
Modality-agnostic files were copied over and the
CHANGESfile was updated. Data was aggregated using:python phenotype.py aggregate subject -i segregated_subject -o aggregated_subjectphenotype.pycame from the GitHub repository: https://github.com/ericearl/bids-phenotypeTHE ORIGINAL DATASET ds003982 README FOLLOWS
A comprehensive clinical, MRI, and MEG collection characterizing healthy research volunteers collected at the National Institute of Mental Health (NIMH) Intramural Research Program (IRP) in Bethesda, Maryland using medical and mental health assessments, diagnostic and dimensional measures of mental health, cognitive and neuropsychological functioning, structural and functional magnetic resonance imaging (MRI), along with diffusion tensor imaging (DTI), and a comprehensive magnetoencephalography battery (MEG).
In addition, blood samples are currently banked for future genetic analysis. All data collected in this protocol are broadly shared in the OpenNeuro repository, in the Brain Imaging Data Structure (BIDS) format. In addition, blood samples of healthy volunteers are banked for future analyses. All data collected in this protocol are broadly shared here, in the Brain Imaging Data Structure (BIDS) format. In addition, task paradigms and basic pre-processing scripts are shared on GitHub. This dataset is unique in its depth of characterization of a healthy population in terms of brain health and will contribute to a wide array of secondary investigations of non-clinical and clinical research questions.
This dataset is licensed under the Creative Commons Zero (CC0) v1.0 License.
Recruitment
Inclusion criteria for the study require that participants are adults at or over 18 years of age in good health with the ability to read, speak, understand, and provide consent in English. All participants provided electronic informed consent for online screening and written informed consent for all other procedures. Exclusion criteria include:
- A history of significant or unstable medical or mental health condition requiring treatment
- Current self-injury, suicidal thoughts or behavior
- Current illicit drug use by history or urine drug screen
- Abnormal physical exam or laboratory result at the time of in-person assessment
- Less than an 8th grade education or IQ below 70
- Current employees, or first-degree relatives of NIMH employees
Study participants are recruited through direct mailings, bulletin boards and listservs, outreach exhibits, print advertisements, and electronic media.
Clinical Measures
All potential volunteers first visit the study website (https://nimhresearchvolunteer.ctss.nih.gov), check a box indicating consent, and complete preliminary self-report screening questionnaires. The study website is HIPAA compliant and therefore does not collect PII ; instead, participants are instructed to contact the study team to provide their identity and contact information. The questionnaires include demographics, clinical history including medications, disability status (WHODAS 2.0), mental health symptoms (modified DSM-5 Self-Rated Level 1 Cross-Cutting Symptom Measure), substance use survey (DSM-5 Level 2), alcohol use (AUDIT), handedness (Edinburgh Handedness Inventory), and perceived health ratings. At the conclusion of the questionnaires, participants are again prompted to send an email to the study team. Survey results, supplemented by NIH medical records review (if present), are reviewed by the study team, who determine if the participant is likely eligible for the protocol. These participants are then scheduled for an in-person assessment. Follow-up phone screenings were also used to determine if participants were eligible for in-person screening.
In-person Assessments
At this visit, participants undergo a comprehensive clinical evaluation to determine final eligibility to be included as a healthy research volunteer. The mental health evaluation consists of a psychiatric diagnostic interview (Structured Clinical Interview for DSM-5 Disorders (SCID-5), along with self-report surveys of mood (Beck Depression Inventory-II (BD-II) and anxiety (Beck Anxiety Inventory, BAI) symptoms. An intelligence quotient (IQ) estimation is determined with the Kaufman Brief Intelligence Test, Second Edition (KBIT-2). The KBIT-2 is a brief (20-30 minute) assessment of intellectual functioning administered by a trained examiner. There are three subtests, including verbal knowledge, riddles, and matrices.
Medical Evaluation
Medical evaluation includes medical history elicitation and systematic review of systems. Biological and physiological measures include vital signs (blood pressure, pulse), as well as weight, height, and BMI. Blood and urine samples are taken and a complete blood count, acute care panel, hepatic panel, thyroid stimulating hormone, viral markers (HCV, HBV, HIV), C-reactive protein, creatine kinase, urine drug screen and urine pregnancy tests are performed. In addition, blood samples that can be used for future genomic analysis, development of lymphoblastic cell lines or other biomarker measures are collected and banked with the NIMH Repository and Genomics Resource (Infinity BiologiX). The Family Interview for Genetic Studies (FIGS) was later added to the assessment in order to provide better pedigree information; the Adverse Childhood Events (ACEs) survey was also added to better characterize potential risk factors for psychopathology. The entirety of the in-person assessment not only collects information relevant for eligibility determination, but it also provides a comprehensive set of standardized clinical measures of volunteer health that can be used for secondary research.
MRI Scan
Participants are given the option to consent for a magnetic resonance imaging (MRI) scan, which can serve as a baseline clinical scan to determine normative brain structure, and also as a research scan with the addition of functional sequences (resting state and diffusion tensor imaging). The MR protocol used was initially based on the ADNI-3 basic protocol, but was later modified to include portions of the ABCD protocol in the following manner:
- The T1 scan from ADNI3 was replaced by the T1 scan from the ABCD protocol.
- The Axial T2 2D FLAIR acquisition from ADNI2 was added, and fat saturation turned on.
- Fat saturation was turned on for the pCASL acquisition.
- The high-resolution in-plane hippocampal 2D T2 scan was removed and replaced with the whole brain 3D T2 scan from the ABCD protocol (which is resolution and bandwidth matched to the T1 scan).
- The slice-select gradient reversal method was turned on for DTI acquisition, and reconstruction interpolation turned off.
- Scans for distortion correction were added (reversed-blip scans for DTI and resting state scans).
- The 3D FLAIR sequence was made optional and replaced by one where the prescription and other acquisition parameters provide resolution and geometric correspondence between the T1 and T2 scans.
At the time of the MRI scan, volunteers are administered a subset of tasks from the NIH Toolbox Cognition Battery. The four tasks include:
- Flanker inhibitory control and attention task assesses the constructs of attention and executive functioning.
- Executive functioning is also assessed using a dimensional change card sort test.
- Episodic memory is evaluated using a picture sequence memory test.
- Working memory is evaluated using a list sorting test.
MEG
An optional MEG study was added to the protocol approximately one year after the study was initiated, thus there are relatively fewer MEG recordings in comparison to the MRI dataset. MEG studies are performed on a 275 channel CTF MEG system (CTF MEG, Coquiltam BC, Canada). The position of the head was localized at the beginning and end of each recording using three fiducial coils. These coils were placed 1.5 cm above the nasion, and at each ear, 1.5 cm from the tragus on a line between the tragus and the outer canthus of the eye. For 48 participants (as of 2/1/2022), photographs were taken of the three coils and used to mark the points on the T1 weighted structural MRI scan for co-registration. For the remainder of the participants (n=16 as of 2/1/2022), a Brainsight neuronavigation system (Rogue Research, Montréal, Québec, Canada) was used to coregister the MRI and fiducial localizer coils in realtime prior to MEG data acquisition.
Specific Measures within Dataset
Online and In-person behavioral and clinical measures, along with the corresponding phenotype file name, sorted first by measurement location and then by file name.
Location Measure File Name Online Alcohol Use Disorders Identification Test (AUDIT) audit Demographics demographics DSM-5 Level 2 Substance Use - Adult drug_use Edinburgh Handedness Inventory (EHI) ehi Health History Form health_history_questions Perceived Health Rating - self health_rating ME/CFS vs Depression Classification Dataset
- kaggle.com
Updated Jun 8, 2025ShareFacebookTwitterEmailClick to copy linkLink copiedCiteArshad Aliyev (2025). ME/CFS vs Depression Classification Dataset [Dataset]. https://www.kaggle.com/datasets/storytellerman/mecfs-vs-depression-classification-datasetCroissantCroissant is a format for machine-learning datasets. Learn more about this at mlcommons.org/croissant.Dataset updatedJun 8, 2025AuthorsArshad AliyevLicenseAttribution-NonCommercial-ShareAlike 4.0 (CC BY-NC-SA 4.0)https://creativecommons.org/licenses/by-nc-sa/4.0/
License information was derived automaticallyDescriptionME/CFS vs Depression Dataset
Welcome to a synthetic dataset designed for classification tasks between Myalgic Encephalomyelitis / Chronic Fatigue Syndrome (ME/CFS) and Depression.
This is the first dataset of its kind created specifically to help beginners and researchers explore complex cases of differential diagnosis in mental and chronic health conditions.🎯 Objective
Predict whether a patient has: -
ME/CFS-Depression- Or both (Both)Based on behavioral, clinical, and symptomatic features.
📋 Features
Feature Name Description agePatient's age genderGender (Male / Female / Other) fatigue_severity_scale_scoreFatigue Severity Scale (FSS), 0–10 depression_phq9_scorePHQ-9 depression score, 0–27 pem_presentWhether Post-Exertional Malaise (PEM) is present (Yes/No or 1/0) pem_duration_hoursDuration of PEM in hours sleep_quality_indexSleep quality (1–10 scale) brain_fog_levelBrain fog level (1–10) physical_pain_scorePhysical pain intensity (1–10) stress_levelStress level (1–10) work_statusWork status: Working / Partially working / Not working social_activity_levelSocial activity: Very low – Very high exercise_frequencyExercise frequency: Never – Daily meditation_or_mindfulnessDoes the patient practice mindfulness or meditation? Yes/No hours_of_sleep_per_nightAverage sleep duration per night diagnosisTarget variable: ME/CFS,Depression,Both⚠️ Key Characteristics
- Contains missing values (
NaN) in most features (1–5%), simulating real-world data collection issues. - All numeric features contain controlled noise to prevent perfect class separation.
- Diagnosis logic is based on clinical-like heuristics, making it suitable for training models that could support real-world decisions.
🛠 Suggested Use Cases
- Binary classification:
ME/CFSvsDepression - Multiclass classification:
ME/CFS,Depression,Both - EDA and feature engineering practice
- Missing data imputation techniques
- Medical ML modeling and interpretability
📦 Format
- CSV file
- ~1,000 rows
- UTF-8 encoding
🙌 Author
Created with ❤️ for the Kaggle community.
If you like this dataset — please upvote!
If you have any suggestions or improvements — feel free to comment.- c
ACRIN 6684
- cancerimagingarchive.net
- dev.cancerimagingarchive.net
csv, xlsx, and zip +2+ more versionsShareFacebookTwitterEmailClick to copy linkLink copiedCiteThe Cancer Imaging Archive, ACRIN 6684 [Dataset]. http://doi.org/10.7937/K9/TCIA.2018.vohlekokn/a, dicom, csv, xlsx, and zipAvailable download formatsUnique identifierhttps://doi.org/10.7937/K9/TCIA.2018.vohlekokDataset authored and provided byThe Cancer Imaging ArchiveLicensehttps://www.cancerimagingarchive.net/data-usage-policies-and-restrictions/https://www.cancerimagingarchive.net/data-usage-policies-and-restrictions/
Time period coveredJul 2, 2019Descriptionhttps://www.cancerimagingarchive.net/wp-content/uploads/nctn-logo-300x108.png" alt="" width="300" height="108" />
Demographic Summary of Available Imaging
Characteristic Value (N = 45) Age (years) Mean ± SD: 57.2 ± 9
Median (IQR): 58 (50-63)
Range: 29-77Sex Male: 29 (64%)
Female: 16 (36%)Race White: 41 (91.1%)
Black: 2 (4.4%)
Asian: 1 (2.2%)
American Indian/Alaska Native: 1 (2.2%)Ethnicity Hispanic: 5 (11.1%)
Non-Hispanic: 39 (86.7%)
Unknown: 1 (2.2%)The objective of the ACRIN 6684 multi-center clinical trial was to determine the association of baseline FMISO PET uptake (maximal tumor to blood ratio, hypoxic volume) and MRI parameters (Ktrans, CBV) with overall survival, time to disease progression, and 6-month progression free survival in participants with newly diagnosed glioblastoma multiforme (GBM). The trial also collected standard brain cancer data such as Karnofsky performance status, but also pathological biomarkers that included MGMT status, HIF1-alpha, GLUT1, CAIX, CD31, and alpha-SMA expression assays.
There are two sets of volumes of interest (VOI) included with the ACRIN 6684 collection of MRI, PET and low-dose CT patient images. These include delineation of enhancing brain tumor lesions and 18F-FMISO PET hypoxia maps. More information about these masks can be found on the Detailed Description tab below. Additional information about the trial is available in the Study Protocol and Case Report Forms.
ACRIN 6684 Study Protocol
After establishing eligibility and enrollment to the study, baseline imaging of both MR and PET was performed within 2 weeks of starting therapy. FMISO, has been helpful in evaluating tumor oxygenation status, which may affect how well it responds to radiation and chemotherapy. The MRI scans were designed to measure tumor characteristics related to oxygenation status, including changes in blood flow, blood volume, and blood vessel size.
In the original protocol, following baseline imaging was an optional test-retest scan for FMISO PET only. Also included were PET and MRI scans at 3 weeks after the onset of chemo/radiation therapy, and 4 weeks following the end of standard treatment. Of the 50 patients enrolled in the study only one patient had a test-retest FMISO scan, and the requirement of scans mid and post therapy were dropped after the 4th case. The current protocol appears in the figure on the right, and can be found online ( Protocol-ACRIN 6684 Amendment 7, 01.24.12 ). The latest protocol for ACRIN 6684 had PET and MR imaging performed only at baseline, up to 2 weeks prior to standard treatment (chemo + radiation therapy). Mid and post-therapy scans were eliminated from the protocol after Case 4, and only one patient had a retest FMISO scan. Of the 50 enrolled patients, 42 patients had evaluable imaging data for the primary aims of the study (see Gerstner et al. 2016).
Note: The MRI DWI/DTI series acquired through GE or Siemens scanners for 30 patients have been stripped of their b-values and diffusion gradient matrix DICOM header fields making them unable to be processed for ADC map production. The patients scanned with Philips MRI scanners are intact.
https://www.cancerimagingarchive.net/wp-content/uploads/image2018-8-14_15-9-18.png" alt="" width="480" height="360" />
- N
Compensatory Mechanisms in Visual Sequence Learning: An fMRI Study of...
- neurovault.org
niftiUpdated Jul 1, 2025ShareFacebookTwitterEmailClick to copy linkLink copiedCite(2025). Compensatory Mechanisms in Visual Sequence Learning: An fMRI Study of Children with Developmental Language Disorder: DN INTERACTION PI TD vs DLD [Dataset]. http://identifiers.org/neurovault.image:901859niftiAvailable download formatsUnique identifierhttps://identifiers.org/neurovault.image:901859Dataset updatedJul 1, 2025LicenseCC0 1.0 Universal Public Domain Dedicationhttps://creativecommons.org/publicdomain/zero/1.0/
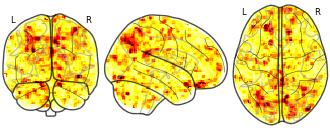
License information was derived automaticallyDescriptionGroup × Time interaction on PI-related brain activation in the Difficult-to-Name (DN) condition. Highlights regions where the relationship between statistical learning performance (PI) and brain activity differs between TD and DLD groups across pre- and post-training.
Collection description
This dataset includes whole-brain statistical maps from a longitudinal fMRI study investigating visual statistical learning (SL) in children aged 6–9 years with developmental language disorder (DLD; n = 27) and typically developing (TD; n = 35) peers. Participants completed an SL task involving visual sequences under two stimulus conditions: easy-to-name(EN; animal drawings) and difficult-to-name (DN; abstract Hebrew letters). Sequences were either structured (1-back transitional probabilities) or random. Functional scans were collected at two time points: before and after one week of home-based SL training.
At the first-level analysis, individual contrast maps were computed comparing BOLD responses to structured vs. random sequences (Statistic > Random), separately for each stimulus type. At the second level, full-factorial SPM12 models (2 Group × 2 Time) were implemented separately for EN and DN conditions. Crucially, group-level models included four z-scored covariates representing individual performance index (PI) for each group and session, enabling the analysis of brain–behavior associations and their modulation by group and training. Additional analyses included F-tests on PI covariates (Group × Time interaction) and t-tests comparing group differences in PI-related activation at each time point.
All functional images were acquired on a 3T Siemens Prisma scanner. Preprocessing included motion correction, normalization to MNI space, and spatial smoothing (6 mm FWHM). Data quality control included framewise displacement scrubbing and a minimum tSNR threshold of 100.
Subject species
homo sapiens
Modality
fMRI-BOLD
Analysis level
group
Cognitive paradigm (task)
Other evaluation task
Map type
F
SynthRAD2023 Grand Challenge validation dataset: synthetizing computed...
- zenodo.org
- explore.openaire.eu
- +1more
zipUpdated Jun 4, 2023ShareFacebookTwitterEmailClick to copy linkLink copiedCiteAdrian Thummerer; Adrian Thummerer; Erik van der Bijl; Erik van der Bijl; Matteo Maspero; Matteo Maspero (2023). SynthRAD2023 Grand Challenge validation dataset: synthetizing computed tomography for radiotherapy [Dataset]. http://doi.org/10.5281/zenodo.7868169zipAvailable download formatsUnique identifierhttps://doi.org/10.5281/zenodo.7868169Dataset updatedJun 4, 2023AuthorsAdrian Thummerer; Adrian Thummerer; Erik van der Bijl; Erik van der Bijl; Matteo Maspero; Matteo MasperoLicenseAttribution-NonCommercial 4.0 (CC BY-NC 4.0)https://creativecommons.org/licenses/by-nc/4.0/
License information was derived automaticallyDescriptionThe dataset can be downloaded from https://doi.org/10.5281/zenodo.7868169 and a detailed description is offered at https://doi.org/10.5281/zenodo.7260704 in the "synthRAD2023_dataset_description.pdf".
The input of the validation datasets for Task1 is in Task1_val.zip, while for Task2 in Task2_val.zip. After unzipping, each Task is organized according to the following folder structure:
Task1_val.zip/
├── Task1
├── brain
├── 1Bxxxx
├── mr.nii.gz
└── mask.nii.gz
├── ...
└── overview
├── 1_brain_val.xlsx
├── 1Bxxxx_val.png
└── ...
└── pelvis
├── 1Pxxxx
├── mr.nii.gz
├── mask.nii.gz
├── ...
└── overview
├── 1_pelvis_val.xlsx
├── 1Pxxxx_val.png
└── ....
Task2_val.zip/
├──Task2
├── brain
├── 2Bxxxx
├── cbct.nii.gz
└── mask.nii.gz
├── ...
└── overview
├── 2_brain_val.xlsx
├── 2Bxxxx_val.png
└── ...
└── pelvis
├── 2Pxxxx
├── cbct.nii.gz
├── mask.nii.gz
├── ...
└── overview
├── 2_pelvis_val.xlsx
├── 2Pxxxx_val.png
└── ....
Each patient folder has a unique name that contains information about the task, anatomy, center and a patient ID. The naming follows the convention below:
[Task] [Anatomy] [Center] [PatientID]
1 B A 001
In each patient folder, two files can be found:
-
mr.nii.gz or cbct.nii.gz (depending on the task): CBCT/MR image
-
mask.nii.gz: image containing a binary mask of the dilated patient outline
For each task and anatomy, an overview folder is provided which contains the following files:
-
[task]_[anatomy]_val.xlsx: This file contains information about the image acquisition protocol for each patient.
-
[task][anatomy][center][PatientID]_val.png: For each patient a png showing axial, coronal and sagittal slices of CBCT/MR, CT, mask and the difference between CBCT/MR and CT is provided. These images are meant to provide a quick visual overview of the data.
DATASET DESCRIPTION
This challenge dataset contains imaging data of patients who underwent radiotherapy in the brain or pelvis region. Overall, the population is predominantly adult and no gender restrictions were considered during data collection. For Task 1, the inclusion criteria were the acquisition of a CT and MRI during treatment planning while for task 2, acquisitions of a CT and CBCT, used for patient positioning, were required. Datasets for task 1 and 2 do not necessarily contain the same patients, given the different image acquisitions for the different tasks.
Data was collected at 3 Dutch university medical centers:
-
Radboud University Medical Center;
-
University Medical Center Utrecht;
-
University Medical Center Groningen.
For anonymization purposes, from here on, institution names are substituted with A, B and C, without specifying which institute each letter refers to.
The following number of patients is available in the validation set.
Validation
Brain
Pelvis
Center A
Center B
Center C
Total
Center A
Center B
Center C
Total
Task 1
10
10
10
30
20
0
10
30
Task 2
10
10
10
30
10
10
10
30
In total, for all tasks and anatomies combined, 120 image pairs are available in this dataset. This repository only contains the validation data. The training data is provided at: https://doi.org/10.5281/zenodo.7260704.
All images were acquired with the clinically used scanners and imaging protocols of the respective centers and reflect typical images found in clinical routine. As a result, imaging protocols and scanner can vary between patients. A detailed description of the imaging protocol for each image, can be found in spreadsheets that are part of the dataset release (see dataset structure).
Data was acquired with the following scanners:
-
Center A:
-
MRI: Philips Ingenia 1.5T/3.0T
-
CT: Philips Brilliance Big Bore or Siemens Biograph20 PET-CT
-
CBCT: Elekta XVI
-
-
Center B:
-
MRI: Siemens MAGNETOM Aera 1.5T or MAGNETOM Avanto_fit 1.5T
-
CT: Siemens SOMATOM Definition AS
-
CBCT: IBA Proteus+ or Elekta XVI
-
-
Center C:
-
MRI: Siemens Avanto fit 1.5T or Siemens MAGNETOM Vida fit 3.0T
-
CT: Philips Brilliance Big Bore
-
CBCT: Elekta XVI
-
For task 1, MRIs were acquired with a T1-weighted gradient echo or an inversion prepared - turbo field echo (TFE) sequence and collected along with the corresponding planning CTs for all subjects. The exact acquisition parameters vary between patients and centers. For centers B and C, selected MRIs were acquired with Gadolinium contrast, while the selected MRIs of center A were acquired without contrast.
For task 2, the CBCTs used for image-guided radiotherapy ensuring accurate patient position were selected for all subjects along with the corresponding planning CT.
The following pre-processing steps were performed on the data:
-
Conversion from dicom to compressed nifti (nii.gz)
-
Rigid registration between CT and MR/CBCT
-
Anonymization (face removal, only for brain patients)
-
Patient outline segmentation (provided as a binary mask)
-
Crop MR/CBCT, CT and mask to remove background and reduce file sizes
The code used to preprocess the images can be found at: https://github.com/SynthRAD2023/. Detailed information about the dataset are provided in SynthRAD2023_dataset_description.pdf published here along with the data and will also be submitted to Medical Physics.
ETHICAL APPROVAL
Each institution received ethical approval from their internal review board/Medical Ethical committee:
-
UMC Utrecht approved not-WMO on 4/03/2022 with number 22/474 entitled: “Synthetizing computed tomography for radiotherapy Grand Challenge (SynthRAD)”.
-
UMC Groningen approved not-WMO on 20/07/2022 with number 202200310 entitled: “Synthesizing computed tomography for radiotherapy - Grand Challenge”.
-
Radboud UMC declared the study not-WMO on 17/10/2022 with number 2022-15950 entitled “Synthetizing computed tomography for radiotherapy Grand Challenge”.
CHALLENGE DESIGN
The overall challenge design can be found at https://doi.org/10.5281/zenodo.7746019.
- N
Compensatory Mechanisms in Visual Sequence Learning: An fMRI Study of...
- neurovault.org
niftiUpdated Jul 1, 2025ShareFacebookTwitterEmailClick to copy linkLink copiedCite(2025). Compensatory Mechanisms in Visual Sequence Learning: An fMRI Study of Children with Developmental Language Disorder: DN PRE TD vs DLD [Dataset]. http://identifiers.org/neurovault.image:901864niftiAvailable download formatsUnique identifierhttps://identifiers.org/neurovault.image:901864Dataset updatedJul 1, 2025LicenseCC0 1.0 Universal Public Domain Dedicationhttps://creativecommons.org/publicdomain/zero/1.0/
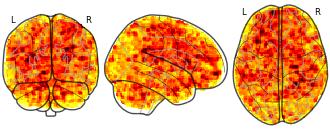
License information was derived automaticallyDescriptionBetween-group comparison of unmodulated brain activation before training (pre-training) in the DN condition. Shows baseline neural differences between TD and DLD groups prior to SL training.
Collection description
This dataset includes whole-brain statistical maps from a longitudinal fMRI study investigating visual statistical learning (SL) in children aged 6–9 years with developmental language disorder (DLD; n = 27) and typically developing (TD; n = 35) peers. Participants completed an SL task involving visual sequences under two stimulus conditions: easy-to-name(EN; animal drawings) and difficult-to-name (DN; abstract Hebrew letters). Sequences were either structured (1-back transitional probabilities) or random. Functional scans were collected at two time points: before and after one week of home-based SL training.
At the first-level analysis, individual contrast maps were computed comparing BOLD responses to structured vs. random sequences (Statistic > Random), separately for each stimulus type. At the second level, full-factorial SPM12 models (2 Group × 2 Time) were implemented separately for EN and DN conditions. Crucially, group-level models included four z-scored covariates representing individual performance index (PI) for each group and session, enabling the analysis of brain–behavior associations and their modulation by group and training. Additional analyses included F-tests on PI covariates (Group × Time interaction) and t-tests comparing group differences in PI-related activation at each time point.
All functional images were acquired on a 3T Siemens Prisma scanner. Preprocessing included motion correction, normalization to MNI space, and spatial smoothing (6 mm FWHM). Data quality control included framewise displacement scrubbing and a minimum tSNR threshold of 100.
Subject species
homo sapiens
Modality
fMRI-BOLD
Analysis level
group
Cognitive paradigm (task)
Other evaluation task
Map type
T
Data from: The physiological effects of non-invasive brain stimulation...
- openneuro.org
Updated May 16, 2019+ more versionsShareFacebookTwitterEmailClick to copy linkLink copiedCiteGabriel Castrillon; Nico Sollmann; Katarzyna Kurcyus; Adeel Razi; Sandro M. Krieg; Valentin Riedl (2019). The physiological effects of non-invasive brain stimulation fundamentally differ across the human cortex [Dataset]. https://openneuro.org/datasets/ds001927/versions/1.0.0Dataset updatedMay 16, 2019AuthorsGabriel Castrillon; Nico Sollmann; Katarzyna Kurcyus; Adeel Razi; Sandro M. Krieg; Valentin RiedlLicenseCC0 1.0 Universal Public Domain Dedicationhttps://creativecommons.org/publicdomain/zero/1.0/
License information was derived automaticallyDescriptionData
Twenty-three healthy participants underwent three counterbalanced rTMS-fMRI sessions on different days, where a prefrontal (FRO), an occipital (OCC) and a temporo-parietal control (CTR) region were identically stimulated with low-frequency (1Hz) rTMS. We measured brain activity with resting state-fMRI before (rest-pre) and immediately after stimulation (rest-post).
Analysis
The following table contains a description of the configuration's or script files needed for the data analysis:
Filename Type Description pipeline_config_cpac_v0.3.9.2.yml YAML Configuration file pipeline for CPAC v0.3.9.2 which runs the pre-processing, FC, timeseries generation and local signal analysis fca_file_extract.sh Bash Extracts and organizes the FCA's files for the statistical analysis anova_rm_spm_batch.mat Matlab SPM's batch configuration file for the one-way repeated measures ANOVA second level analysis spm_contrast_vis.py Python Visualizes the statistically significant contrast's images by overlaying them on a glass brain representation cons_mod_calc.m Matlab Extracts the timeseries generated by CPAC and runs the consensus modularity analysis cons_mod_stats_vis.py Python Visualizes and runs the statistical analysis on the consensus modularity analysis results cv_classifier.py Python Extracts the features and run the cross-validated classification on them local_signal_extraction.sh Bash Extracts and masks the local signal analysis files for the statistical analysis sDCM.m Matlab Extracts the timeseries generated by CPAC and runs the spectral DCM analysis Electrophysiological Signals of Embodiment and MI-BCI Training in VR
- zenodo.org
- data.niaid.nih.gov
zipUpdated Apr 24, 2025ShareFacebookTwitterEmailClick to copy linkLink copiedCiteKatarina Vagaja; Athanasios Vourvopoulos; Athanasios Vourvopoulos; Katarina Vagaja (2025). Electrophysiological Signals of Embodiment and MI-BCI Training in VR [Dataset]. http://doi.org/10.5281/zenodo.8086086zipAvailable download formatsUnique identifierhttps://doi.org/10.5281/zenodo.8086086Dataset updatedApr 24, 2025AuthorsKatarina Vagaja; Athanasios Vourvopoulos; Athanasios Vourvopoulos; Katarina VagajaLicenseAttribution 4.0 (CC BY 4.0)https://creativecommons.org/licenses/by/4.0/
License information was derived automaticallyDescriptionDATASET DETAILS:
Participant demographics:
A total of 26 participants were included, consisting of 10 males (mean age 25.4 ± 7.4) and 16 females (mean age 23 ± 3.2). All participants were right-handed, reported normal or corrected-to-normal vision, and had no motor impairments. Three participants had previous experience with BCIs, and five participants used VR more than twice. Participants were randomly assigned to either the embodied group (N=13) or the non-embodied group (N=13), which served as a control. All participants signed an informed consent before participating in the study in accordance with the 1964 Declaration of Helsinki.
Experiment Description:
A between-subject design was used to investigate the effect of virtual embodiment priming phase on the subsequent motor-imagery training phase in VR. The experiment comprised four main blocks: (1) equipment setup and instructions (45-60 minutes), (2) resting state EEG recording (4 minutes), (3) inducing or breaking the sense of embodiment in VR (5 minutes), and (4) MI training in VR (15 minutes). The entire experiment lasted approximately 90-120 minutes. Directly after block 3, participants answered a questionnaire that measured their subjective sense of embodiment and physical presence.
Equipment:
A wireless EEG amplifier (LiveAmp; Brain Products GmbH, Gilching, Germany) was used, with 32 active EEG electrodes (+3 ACC) with a sampling rate of 500Hz. In addition, EMG, and Temperature signals (in uV) have been recorded synchronously in a bipolar montage and connected to the EEG amplifier’s AUX input through the Brain Products BIP2AUX adapter.
Visual feedback was provided through an Oculus Rift CV1 headset (Reality Labs, formerly Facebook, Inc., CA, USA).
Channel Indices:
EEG: 1-32
EMG Left (AUX1): 33
EMG Right. (AUX2): 34
Temperature (AUX3): 35
ACC: 36-38Event codes:
Code Description S01 Experiment Start S02 Baseline Start S03 Baseline Stop S04 Start Of Trial S05 Cross On Screen S07 class1, Left hand S08 class2, Right hand S09 Feedback Continuous S10 End of Trial S11 End Of Session S12 Experiment Stop Directory tree:
ROOT
|
+--- GROUP [Control or Embodied]
| +---USER #
| | +---TASK #
| | | +---Resting State
| | | | .eeg
| | | | .vhdr
| | | | .vmrk
| | | +---Embodiment
| | | | .eeg
| | | | .vhdr
| | | | .vmrk
| | | +---MI
| | | | .eeg
| | | | .vhdr
| | | | .vmrkFor demographics and questionnaire data, please contact the authors.
- d
Data from: Environmental and genetic control of brain and song structure in...
- datadryad.org
- zenodo.org
zipUpdated Aug 22, 2013ShareFacebookTwitterEmailClick to copy linkLink copiedCiteJoseph Luke Woodgate; Katherine L. Buchanan; Andrew T. D. Bennett; Clive K. Catchpole; Roswitha Brighton; Stefan Leitner; Andrew T.D. Bennett (2013). Environmental and genetic control of brain and song structure in the zebra finch [Dataset]. http://doi.org/10.5061/dryad.3d7t5zipAvailable download formatsUnique identifierhttps://doi.org/10.5061/dryad.3d7t5Dataset updatedAug 22, 2013Dataset provided byDryadAuthorsJoseph Luke Woodgate; Katherine L. Buchanan; Andrew T. D. Bennett; Clive K. Catchpole; Roswitha Brighton; Stefan Leitner; Andrew T.D. BennettTime period covered2013DescriptionBrain body and song variables for 48 male zebra finches, their fathers and foster-fathers, including details of rearing environmentData for Environmental and genetic control of brain & song.xlsx
Neuroscience Market
- transparencymarketresearch.com
csv, pdfUpdated Feb 28, 2024ShareFacebookTwitterEmailClick to copy linkLink copiedCiteTransparency Market Research (2024). Neuroscience Market [Dataset]. https://www.transparencymarketresearch.com/neuroscience-market.htmlpdf, csvAvailable download formatsDataset updatedFeb 28, 2024Dataset authored and provided byTransparency Market ResearchLicensehttps://www.transparencymarketresearch.com/privacy-policy.htmlhttps://www.transparencymarketresearch.com/privacy-policy.html
Time period covered2023 - 2031Area coveredWorldwideDescription- The global industry was valued at US$ 30.1 Bn in 2022
- It is estimated to grow at a CAGR of 3.7% from 2023 to 2031 and reach US$ 41.6 Bn by the end of 2031
Market Introduction
Attribute Detail Market Drivers - Increase in Prevalence of Degenerative Neurological Disorders
- Advancements in Technologies
Neuroscience Market Regional Insights
Attribute Detail Leading Region North America Neuroscience Market Snapshot
Attribute Detail Market Size in 2022 US$ 30.1 Bn Market Forecast (Value) in 2031 US$ 41.6 Bn Growth Rate (CAGR) 3.7% Forecast Period 2023-2031 Historical Data Available for 2017-2021 Quantitative Units US$ Bn for Value Market Analysis It includes segment analysis as well as regional level analysis. Moreover, qualitative analysis includes drivers, restraints, opportunities, key trends, Porter’s Five Forces analysis, value chain analysis, and key trend analysis. Competition Landscape - Market share analysis by company (2022)
- Company profiles section includes overview, product portfolio, sales footprint, key subsidiaries or distributors, strategy & recent developments, and key financials
Format Electronic (PDF) + Excel Market Segmentation - Component
- Instrument
- Software
- Services
- Technology
- Whole Brain Imaging
- Neuro-microscopy
- Electrophysiology
- Neuroproteomics Analysis
- Animal Behavior Analysis
- Neuro-functional Analysis
- Others
- End-user
- Hospitals
- Diagnostic Laboratories
- Academic & Research Institutions
- Others
Regions Covered - North America
- Europe
- Asia Pacific
- Latin America
- Middle East & Africa
Countries Covered - U.S.
- Canada
- Germany
- U.K.
- France
- Italy
- Spain
- China
- India
- Japan
- Australia & New Zealand
- Brazil
- Mexico
- South Africa
- GCC
Companies Profiled - NEURALINK
- Kernel
- BrainCo, Inc.
- MindMaze
- Paradromics
- NeuroPro
- NeuroSky
- EMOTIV, Inc.
- Cercare Medical A/S
- Plexon, Inc.
- Noldus Information Technology B.V.
- Femtonics Ltd.
- Neuralynx, Inc.
- Neurable, Inc.
- Bitbrain Technologies
- Halo Neuroscience
- NeuroNexus Technologies, Inc.
Customization Scope Available Upon Request Pricing Available Upon Request Software and data for "In-silico molecular enrichment and clearance of the...
- zenodo.org
html, mp4, zipUpdated Jun 6, 2025ShareFacebookTwitterEmailClick to copy linkLink copiedCiteMarius Causemann; Marius Causemann; Rami Masri; Rami Masri; Miroslav Kuchta; Miroslav Kuchta; Marie E. Rognes; Marie E. Rognes (2025). Software and data for "In-silico molecular enrichment and clearance of the human intracranial space" [Dataset]. http://doi.org/10.5281/zenodo.14749163mp4, zip, htmlAvailable download formatsUnique identifierhttps://doi.org/10.5281/zenodo.14749163Dataset updatedJun 6, 2025AuthorsMarius Causemann; Marius Causemann; Rami Masri; Rami Masri; Miroslav Kuchta; Miroslav Kuchta; Marie E. Rognes; Marie E. RognesLicenseAttribution 4.0 (CC BY 4.0)https://creativecommons.org/licenses/by/4.0/
License information was derived automaticallyDescriptionThis repository provides the software and data for the paper
In particular, it contains the following data:
file description code.zipThe code used to run all simulations and postprocessing steps. Detailed instructions on how to install and run the software can be found in the following github repository:
surfaces.zipThe surface triangulations extracted from the segmentations in
.plyformat, suitable for viewing in e.g. paraview or further processing.standardmesh.zipThe mesh used to run all simulations in
.xdmfformat.standard.xdmf: complete mesh, including markers for parenchyma and CSF spaces.standard_outer.xdmf: only CSF spaces.*_facets.xdmf: respective boundary markers
pvsnetworks.zip1D representation of the arterial and venous networks, as well as the 3D cylinder corresponding to the vessel diameter.
segmentation.zipSynthseg segmentations of the T1 data and binary masks of venous and arterial networks from Hodneland et al.
modelA.zipSimulation results (concentration values in CSF, parenchyma and PVS in 10min steps) for the baseline model in the paper.
modelA.htmlInteractive visualization of the tracer spreading for the baseline model in the paper. Also available here.
modelA.mp4Animation of the tracer spreading for the baseline model in the paper.
modelA-strongVM.zipSimulation results (concentration values in CSF, parenchyma and PVS in 10min steps) for the high PVS flow model in the paper.
modelA-strongVM.htmlInteractive visualization of the tracer spreading for the high PVS flow model in the paper. Also available here.
modelA-strongVM.mp4Animation of the tracer spreading for the high PVS flow model in the paper.

Not seeing a result you expected?
Learn how you can add new datasets to our index.
FacebookTwitterAttribution 4.0 (CC BY 4.0)https://creativecommons.org/licenses/by/4.0/
License information was derived automatically
Experiment Description:
This experiment involved 12 healthy subjects with no prior experience on neurofeedback or BCI, and without any known neurological disorders. All participants are right-handed, except one ambidextrous (participant #5). All participants have provided their signed informed consent for participating in the study in accordance with the 1964 Declaration of Helsinki.
The experiment had been conducted in a laboratory environment under controlled conditions. The subjects went through three sessions lasting maximum two hours, during three consecutive days and each day at approximately at the same hour.
During each session, participants underwent three different conditions. The first condition was always the ”resting-state”: the user was asked to keep the eyes open for two minutes staring at a screen with a green cross and a red arrow pointing up, and then closed for the other two minutes. After this, two more conditions followed related to a Motor Imagery (MI) task performed in a randomized order between left|right-hand movement. The two MI conditions consisted of two phases each: a training phase and a test phase. The general experimental routine for both of them was the same: each trial lasted 6 seconds (2 seconds baseline and 4 seconds MI), forewarned by the appearance of a green cross on the screen and a concomitant beep-sound a second before the onset of the task.
Then, an arrow was appearing pointing left or right, and the subject had to imagine the movement of the corresponding arm reaching an object in front of the Baxter Robot (Rethink Robotics, Bochum, Germany). For both phases, 20 trials from left and 20 trials for right MI were generated in a randomized order, for a total of 40 trials. Finally, there was an inter-trial interval that extended randomly between 1.5 and 3.5 seconds.
Overall, this study resulted into 180 EEG datasets.
Data Description:
| Data Format | General Data Format (GDF) |
| Sampling Rate | 250 Hz |
| Channels | 32 EEG + 3 ACC. |
| EEG system | LiveAmp 32 with active electrodes actiCAP (Brain Products GmbH, Gilching, Germany) |
Events:
| Code | Description |
| 32775 | Baseline Start |
| 32776 | Baseline Stop |
| 768 | Start of Trial, Trigger at t=0s |
| 786 | Cross on screen (BCI experiment) |
| 33282 | Beep |
| 769 | class1, Left hand - cue onset |
| 770 | class2, Right hand - cue onset |
| 781 | Feedback (continuous) - onset |
| 800 | End Of Trial |
| 1010 | End Of Session |
| 33281 | Train |
| 32770 | Experiment Stop |
Directory Tree:
ROOT
| chanlocs.locs
|
|
+--- USER #
| +---SESSION #
| | +---CONDITION #
| | | \---RESTING_STATE
| | | +---1st_PERSON
| | | | TRAINING
| | | | ONLINE
| | | +---3rd_PERSON
| | | | TRAINING
| | | | ONLINE