- m
Educational Attainment in North Carolina Public Schools: Use of statistical...
- data.mendeley.com
Updated Nov 14, 2018 Share
Share Facebook
 Twitter
 EmailClick to copy linkLink copiedCiteScott Herford (2018). Educational Attainment in North Carolina Public Schools: Use of statistical modeling, data mining techniques, and machine learning algorithms to explore 2014-2017 North Carolina Public School datasets. [Dataset]. http://doi.org/10.17632/6cm9wyd5g5.1Unique identifierhttps://doi.org/10.17632/6cm9wyd5g5.1Dataset updatedNov 14, 2018AuthorsScott HerfordLicense
Attribution 4.0 (CC BY 4.0)https://creativecommons.org/licenses/by/4.0/
License information was derived automaticallyDescriptionThe purpose of data mining analysis is always to find patterns of the data using certain kind of techiques such as classification or regression. It is not always feasible to apply classification algorithms directly to dataset. Before doing any work on the data, the data has to be pre-processed and this process normally involves feature selection and dimensionality reduction. We tried to use clustering as a way to reduce the dimension of the data and create new features. Based on our project, after using clustering prior to classification, the performance has not improved much. The reason why it has not improved could be the features we selected to perform clustering are not well suited for it. Because of the nature of the data, classification tasks are going to provide more information to work with in terms of improving knowledge and overall performance metrics. From the dimensionality reduction perspective: It is different from Principle Component Analysis which guarantees finding the best linear transformation that reduces the number of dimensions with a minimum loss of information. Using clusters as a technique of reducing the data dimension will lose a lot of information since clustering techniques are based a metric of 'distance'. At high dimensions euclidean distance loses pretty much all meaning. Therefore using clustering as a "Reducing" dimensionality by mapping data points to cluster numbers is not always good since you may lose almost all the information. From the creating new features perspective: Clustering analysis creates labels based on the patterns of the data, it brings uncertainties into the data. By using clustering prior to classification, the decision on the number of clusters will highly affect the performance of the clustering, then affect the performance of classification. If the part of features we use clustering techniques on is very suited for it, it might increase the overall performance on classification. For example, if the features we use k-means on are numerical and the dimension is small, the overall classification performance may be better. We did not lock in the clustering outputs using a random_state in the effort to see if they were stable. Our assumption was that if the results vary highly from run to run which they definitely did, maybe the data just does not cluster well with the methods selected at all. Basically, the ramification we saw was that our results are not much better than random when applying clustering to the data preprocessing. Finally, it is important to ensure a feedback loop is in place to continuously collect the same data in the same format from which the models were created. This feedback loop can be used to measure the model real world effectiveness and also to continue to revise the models from time to time as things change.
- Z
Data Analysis for the Systematic Literature Review of DL4SE
- data.niaid.nih.gov
- data-staging.niaid.nih.gov
Updated Jul 19, 2024ShareFacebookTwitterEmailClick to copy linkLink copiedCiteCody Watson; Nathan Cooper; David Nader; Kevin Moran; Denys Poshyvanyk (2024). Data Analysis for the Systematic Literature Review of DL4SE [Dataset]. https://data.niaid.nih.gov/resources?id=zenodo_4768586Dataset updatedJul 19, 2024Dataset provided byWashington and Lee University
College of William and MaryAuthorsCody Watson; Nathan Cooper; David Nader; Kevin Moran; Denys PoshyvanykLicenseAttribution 4.0 (CC BY 4.0)https://creativecommons.org/licenses/by/4.0/
License information was derived automaticallyDescriptionData Analysis is the process that supports decision-making and informs arguments in empirical studies. Descriptive statistics, Exploratory Data Analysis (EDA), and Confirmatory Data Analysis (CDA) are the approaches that compose Data Analysis (Xia & Gong; 2014). An Exploratory Data Analysis (EDA) comprises a set of statistical and data mining procedures to describe data. We ran EDA to provide statistical facts and inform conclusions. The mined facts allow attaining arguments that would influence the Systematic Literature Review of DL4SE.
The Systematic Literature Review of DL4SE requires formal statistical modeling to refine the answers for the proposed research questions and formulate new hypotheses to be addressed in the future. Hence, we introduce DL4SE-DA, a set of statistical processes and data mining pipelines that uncover hidden relationships among Deep Learning reported literature in Software Engineering. Such hidden relationships are collected and analyzed to illustrate the state-of-the-art of DL techniques employed in the software engineering context.
Our DL4SE-DA is a simplified version of the classical Knowledge Discovery in Databases, or KDD (Fayyad, et al; 1996). The KDD process extracts knowledge from a DL4SE structured database. This structured database was the product of multiple iterations of data gathering and collection from the inspected literature. The KDD involves five stages:
Selection. This stage was led by the taxonomy process explained in section xx of the paper. After collecting all the papers and creating the taxonomies, we organize the data into 35 features or attributes that you find in the repository. In fact, we manually engineered features from the DL4SE papers. Some of the features are venue, year published, type of paper, metrics, data-scale, type of tuning, learning algorithm, SE data, and so on.
Preprocessing. The preprocessing applied was transforming the features into the correct type (nominal), removing outliers (papers that do not belong to the DL4SE), and re-inspecting the papers to extract missing information produced by the normalization process. For instance, we normalize the feature “metrics” into “MRR”, “ROC or AUC”, “BLEU Score”, “Accuracy”, “Precision”, “Recall”, “F1 Measure”, and “Other Metrics”. “Other Metrics” refers to unconventional metrics found during the extraction. Similarly, the same normalization was applied to other features like “SE Data” and “Reproducibility Types”. This separation into more detailed classes contributes to a better understanding and classification of the paper by the data mining tasks or methods.
Transformation. In this stage, we omitted to use any data transformation method except for the clustering analysis. We performed a Principal Component Analysis to reduce 35 features into 2 components for visualization purposes. Furthermore, PCA also allowed us to identify the number of clusters that exhibit the maximum reduction in variance. In other words, it helped us to identify the number of clusters to be used when tuning the explainable models.
Data Mining. In this stage, we used three distinct data mining tasks: Correlation Analysis, Association Rule Learning, and Clustering. We decided that the goal of the KDD process should be oriented to uncover hidden relationships on the extracted features (Correlations and Association Rules) and to categorize the DL4SE papers for a better segmentation of the state-of-the-art (Clustering). A clear explanation is provided in the subsection “Data Mining Tasks for the SLR od DL4SE”. 5.Interpretation/Evaluation. We used the Knowledge Discover to automatically find patterns in our papers that resemble “actionable knowledge”. This actionable knowledge was generated by conducting a reasoning process on the data mining outcomes. This reasoning process produces an argument support analysis (see this link).
We used RapidMiner as our software tool to conduct the data analysis. The procedures and pipelines were published in our repository.
Overview of the most meaningful Association Rules. Rectangles are both Premises and Conclusions. An arrow connecting a Premise with a Conclusion implies that given some premise, the conclusion is associated. E.g., Given that an author used Supervised Learning, we can conclude that their approach is irreproducible with a certain Support and Confidence.
Support = Number of occurrences this statement is true divided by the amount of statements Confidence = The support of the statement divided by the number of occurrences of the premise
- f
Main procedures of K-means.
- figshare.com
- plos.figshare.com
xlsUpdated Jun 2, 2023+ more versionsShareFacebookTwitterEmailClick to copy linkLink copiedCiteQiwei Wang; Xiaoya Zhu; Manman Wang; Fuli Zhou; Shuang Cheng (2023). Main procedures of K-means. [Dataset]. http://doi.org/10.1371/journal.pone.0286034.t002xlsAvailable download formatsUnique identifierhttps://doi.org/10.1371/journal.pone.0286034.t002Dataset updatedJun 2, 2023Dataset provided byPLOS ONEAuthorsQiwei Wang; Xiaoya Zhu; Manman Wang; Fuli Zhou; Shuang ChengLicenseAttribution 4.0 (CC BY 4.0)https://creativecommons.org/licenses/by/4.0/
License information was derived automaticallyDescriptionThe coronavirus disease 2019 pandemic has impacted and changed consumer behavior because of a prolonged quarantine and lockdown. This study proposed a theoretical framework to explore and define the influencing factors of online consumer purchasing behavior (OCPB) based on electronic word-of-mouth (e-WOM) data mining and analysis. Data pertaining to e-WOM were crawled from smartphone product reviews from the two most popular online shopping platforms in China, Jingdong.com and Taobao.com. Data processing aimed to filter noise and translate unstructured data from complex text reviews into structured data. The machine learning based K-means clustering method was utilized to cluster the influencing factors of OCPB. Comparing the clustering results and Kotler’s five products level, the influencing factors of OCPB were clustered around four categories: perceived emergency context, product, innovation, and function attributes. This study contributes to OCPB research by data mining and analysis that can adequately identify the influencing factors based on e-WOM. The definition and explanation of these categories may have important implications for both OCPB and e-commerce.
Figure 2 from manuscript Sparsely-Connected Autoencoder (SCA) for single...
- figshare.com
zipUpdated Aug 26, 2020ShareFacebookTwitterEmailClick to copy linkLink copiedCiteRaffaele Calogero (2020). Figure 2 from manuscript Sparsely-Connected Autoencoder (SCA) for single cell RNAseq data mining [Dataset]. http://doi.org/10.6084/m9.figshare.12865649.v1zipAvailable download formatsUnique identifierhttps://doi.org/10.6084/m9.figshare.12865649.v1Dataset updatedAug 26, 2020AuthorsRaffaele CalogeroLicenseAttribution 4.0 (CC BY 4.0)https://creativecommons.org/licenses/by/4.0/
License information was derived automaticallyDescriptionDataset used to generate Figure 2 (/fig2.png). Fig. 2: SCA analysis using a TF-based latent space. A) five clusters were detected analysing setA with griph using log10 transformed counts table. Each cluster is made by more than 90% by one cell type. A little amount of HSC is contaminating B cells, monocytes and naïve T cells (/setA/results/setA). Latent space clustering was done with SIMLR (/setA/results/setATF_SIMLR) B) QCC violin plot (/setA/Results/setATF_SIMLR/5/setA_stabilityPlot.pdf). The metric is an extension of CSS and it measures the ability of latent space to keep aggregated cells belonging to predefined clusters, i.e. those in panel A. C) QCM violin plot (/setA/Results/setATF_SIMLR/5/setA_stabilityPlotUNBIAS.pdf), this metric is also an extension of CSS and it measures the ability of the neural network to generate consistent data over multiple SCA runs. Dashed red line indicates the defined threshold to consider the latent space information suitable to support cells’ clusters. Input counts table for SCA analysis is log10 transformed.
- f
MVR performance t-test result.
- figshare.com
xlsUpdated Aug 23, 2024ShareFacebookTwitterEmailClick to copy linkLink copiedCiteMajid Hameed Ahmed; Sabrina Tiun; Nazlia Omar; Nor Samsiah Sani (2024). MVR performance t-test result. [Dataset]. http://doi.org/10.1371/journal.pone.0309206.t005xlsAvailable download formatsUnique identifierhttps://doi.org/10.1371/journal.pone.0309206.t005Dataset updatedAug 23, 2024Dataset provided byPLOS ONEAuthorsMajid Hameed Ahmed; Sabrina Tiun; Nazlia Omar; Nor Samsiah SaniLicenseAttribution 4.0 (CC BY 4.0)https://creativecommons.org/licenses/by/4.0/
License information was derived automaticallyDescriptionClustering texts together is an essential task in data mining and information retrieval, whose aim is to group unlabeled texts into meaningful clusters that facilitate extracting and understanding useful information from large volumes of textual data. However, clustering short texts (STC) is complex because they typically contain sparse, ambiguous, noisy, and lacking information. One of the challenges for STC is finding a proper representation for short text documents to generate cohesive clusters. However, typically, STC considers only a single-view representation to do clustering. The single-view representation is inefficient for representing text due to its inability to represent different aspects of the target text. In this paper, we propose the most suitable multi-view representation (MVR) (by finding the best combination of different single-view representations) to enhance STC. Our work will explore different types of MVR based on different sets of single-view representation combinations. The combination of the single-view representations is done by a fixed length concatenation via Principal Component analysis (PCA) technique. Three standard datasets (Twitter, Google News, and StackOverflow) are used to evaluate the performances of various sets of MVRs on STC. Based on experimental results, the best combination of single-view representation as an effective for STC was the 5-views MVR (a combination of BERT, GPT, TF-IDF, FastText, and GloVe). Based on that, we can conclude that MVR improves the performance of STC; however, the design for MVR requires selective single-view representations.
Beginner Data Mining Datasets
- kaggle.com
zipUpdated May 28, 2022ShareFacebookTwitterEmailClick to copy linkLink copiedCiteverdecali (2022). Beginner Data Mining Datasets [Dataset]. https://www.kaggle.com/datasets/verdecali/beginner-data-mining-datasetszip(1672021 bytes)Available download formatsDataset updatedMay 28, 2022AuthorsverdecaliDescriptionThese are artificially made beginner data mining datasets for learning purposes.
Case study:
- FEELS LIKE HOME is an interior design company, which has about 100 000 registered customers and provide services for more than 200 000 clients annually.
- The range of the products can be divided in 5 major classes: Decor accessories, Furniture, Textiles, Lighting and Art with an option to purchase Limited Edition versions for an extra charge. These goods can be distributed by 3 channels: Physical stores, yearly catalogs and the companies’ website.
- FEELS LIKE HOME has been doing a great job during recent years, achieving decent profits and revenues, but the future remains volatile. In order to solve the problem of instability the company is planning to launch new marketing program, especially to improve the accuracy of marketing campaigns.
The aim of FeelsLikeHome_Campaign dataset is to create project is in which you build a predictive model (using a sample of 2500 clients’ data) forecasting the highest profit from the next marketing campaign, which will indicate the customers who will be the most likely to accept the offer.
The aim of FeelsLikeHome_Cluster dataset is to create project in which you split company’s customer base on homogenous clusters (using 5000 clients’ data) and propose draft marketing strategies for these groups based on customer behavior and information about their profile.
FeelsLikeHome_Score dataset can be used to calculate total profit from marketing campaign and for producing a list of sorted customers by the probability of the dependent variable in predictive model problem.
ELKI Multi-View Clustering Data Sets Based on the Amsterdam Library of...
- zenodo.org
- elki-project.github.io
- +1more
application/gzipUpdated May 2, 2024ShareFacebookTwitterEmailClick to copy linkLink copiedCiteErich Schubert; Erich Schubert; Arthur Zimek; Arthur Zimek (2024). ELKI Multi-View Clustering Data Sets Based on the Amsterdam Library of Object Images (ALOI) [Dataset]. http://doi.org/10.5281/zenodo.6355684application/gzipAvailable download formatsUnique identifierhttps://doi.org/10.5281/zenodo.6355684Dataset updatedMay 2, 2024AuthorsErich Schubert; Erich Schubert; Arthur Zimek; Arthur ZimekLicenseAttribution 4.0 (CC BY 4.0)https://creativecommons.org/licenses/by/4.0/
License information was derived automaticallyTime period covered2022DescriptionThese data sets were originally created for the following publications:
M. E. Houle, H.-P. Kriegel, P. Kröger, E. Schubert, A. Zimek
Can Shared-Neighbor Distances Defeat the Curse of Dimensionality?
In Proceedings of the 22nd International Conference on Scientific and Statistical Database Management (SSDBM), Heidelberg, Germany, 2010.H.-P. Kriegel, E. Schubert, A. Zimek
Evaluation of Multiple Clustering Solutions
In 2nd MultiClust Workshop: Discovering, Summarizing and Using Multiple Clusterings Held in Conjunction with ECML PKDD 2011, Athens, Greece, 2011.The outlier data set versions were introduced in:
E. Schubert, R. Wojdanowski, A. Zimek, H.-P. Kriegel
On Evaluation of Outlier Rankings and Outlier Scores
In Proceedings of the 12th SIAM International Conference on Data Mining (SDM), Anaheim, CA, 2012.They are derived from the original image data available at https://aloi.science.uva.nl/
The image acquisition process is documented in the original ALOI work: J. M. Geusebroek, G. J. Burghouts, and A. W. M. Smeulders, The Amsterdam library of object images, Int. J. Comput. Vision, 61(1), 103-112, January, 2005
Additional information is available at: https://elki-project.github.io/datasets/multi_view
The following views are currently available:
Feature type Description Files Object number Sparse 1000 dimensional vectors that give the true object assignment objs.arff.gz RGB color histograms Standard RGB color histograms (uniform binning) aloi-8d.csv.gz aloi-27d.csv.gz aloi-64d.csv.gz aloi-125d.csv.gz aloi-216d.csv.gz aloi-343d.csv.gz aloi-512d.csv.gz aloi-729d.csv.gz aloi-1000d.csv.gz HSV color histograms Standard HSV/HSB color histograms in various binnings aloi-hsb-2x2x2.csv.gz aloi-hsb-3x3x3.csv.gz aloi-hsb-4x4x4.csv.gz aloi-hsb-5x5x5.csv.gz aloi-hsb-6x6x6.csv.gz aloi-hsb-7x7x7.csv.gz aloi-hsb-7x2x2.csv.gz aloi-hsb-7x3x3.csv.gz aloi-hsb-14x3x3.csv.gz aloi-hsb-8x4x4.csv.gz aloi-hsb-9x5x5.csv.gz aloi-hsb-13x4x4.csv.gz aloi-hsb-14x5x5.csv.gz aloi-hsb-10x6x6.csv.gz aloi-hsb-14x6x6.csv.gz Color similiarity Average similarity to 77 reference colors (not histograms) 18 colors x 2 sat x 2 bri + 5 grey values (incl. white, black) aloi-colorsim77.arff.gz (feature subsets are meaningful here, as these features are computed independently of each other) Haralick features First 13 Haralick features (radius 1 pixel) aloi-haralick-1.csv.gz Front to back Vectors representing front face vs. back faces of individual objects front.arff.gz Basic light Vectors indicating basic light situations light.arff.gz Manual annotations Manually annotated object groups of semantically related objects such as cups manual1.arff.gz Outlier Detection Versions
Additionally, we generated a number of subsets for outlier detection:
Feature type Description Files RGB Histograms Downsampled to 100000 objects (553 outliers) aloi-27d-100000-max10-tot553.csv.gz aloi-64d-100000-max10-tot553.csv.gz Downsampled to 75000 objects (717 outliers) aloi-27d-75000-max4-tot717.csv.gz aloi-64d-75000-max4-tot717.csv.gz Downsampled to 50000 objects (1508 outliers) aloi-27d-50000-max5-tot1508.csv.gz aloi-64d-50000-max5-tot1508.csv.gz E-Commerce Products Dataset For Record Linkage
- kaggle.com
zipUpdated Nov 30, 2025ShareFacebookTwitterEmailClick to copy linkLink copiedCiteFurkan Gözükara (2025). E-Commerce Products Dataset For Record Linkage [Dataset]. https://www.kaggle.com/furkangozukara/ecommerce-products-dataset-for-record-linkagezip(215619488 bytes)Available download formatsDataset updatedNov 30, 2025AuthorsFurkan GözükaraDescription-> If you use Turkish_Ecommerce_Products_by_Gozukara_and_Ozel_2016 dataset, please cite: https://academic.oup.com/comjnl/advance-article-abstract/doi/10.1093/comjnl/bxab179/6425234
@article{10.1093/comjnl/bxab179, author = {Gözükara, Furkan and Özel, Selma Ayşe}, title = "{An Incremental Hierarchical Clustering Based System For Record Linkage In E-Commerce Domain}", journal = {The Computer Journal}, year = {2021}, month = {11}, abstract = "{In this study, a novel record linkage system for E-commerce products is presented. Our system aims to cluster the same products that are crawled from different E-commerce websites into the same cluster. The proposed system achieves a very high success rate by combining both semi-supervised and unsupervised approaches. Unlike the previously proposed systems in the literature, neither a training set nor structured corpora are necessary. The core of the system is based on Hierarchical Agglomerative Clustering (HAC); however, the HAC algorithm is modified to be dynamic such that it can efficiently cluster a stream of incoming new data. Since the proposed system does not depend on any prior data, it can cluster new products. The system uses bag-of-words representation of the product titles, employs a single distance metric, exploits multiple domain-based attributes and does not depend on the characteristics of the natural language used in the product records. To our knowledge, there is no commonly used tool or technique to measure the quality of a clustering task. Therefore in this study, we use ELKI (Environment for Developing KDD-Applications Supported by Index-Structures), an open-source data mining software, for performance measurement of the clustering methods; and show how to use ELKI for this purpose. To evaluate our system, we collect our own dataset and make it publicly available to researchers who study E-commerce product clustering. Our proposed system achieves 96.25\% F-Measure according to our experimental analysis. The other state-of-the-art clustering systems obtain the best 89.12\% F-Measure.}", issn = {0010-4620}, doi = {10.1093/comjnl/bxab179}, url = {https://doi.org/10.1093/comjnl/bxab179}, note = {bxab179}, eprint = {https://academic.oup.com/comjnl/advance-article-pdf/doi/10.1093/comjnl/bxab179/41133297/bxab179.pdf}, }
-> elki-bundle-0.7.2-SNAPSHOT.jar Is the ELKI bundle that we have compiled from the github source code of ELKI. The date of the source code is 6 June 2016. The compile command is as below: ->-> mvn -DskipTests -Dmaven.javadoc.skip=true -P svg,bundle package ->-> Github repository of ELKI: https://github.com/elki-project/elki ->-> This bundle file is used for all of the experiments that are presented in the article
-> Turkish_Ecommerce_Products_by_Gozukara_and_Ozel_2016 dataset is composed as below: ->-> Top 50 E-commerce websites that operate in Turkey are crawled, and their attributes are extracted. ->-> The crawling is made between 2015-01-13 15:12:46 ---- 2015-01-17 19:07:53 dates. ->-> Then 250 product offers from Vatanbilgisayar are randomly selected. ->-> Then the entire dataset is manually scanned to find which other products that are sold in different E-commerce websites are same as the selected ones. ->-> Then each product is classified respectively. ->-> This dataset contains these products along with their price (if available), title, categories (if available), free text description (if available), wrapped features (if available), crawled URL (the URL might have expired) attributes
-> The dataset files are provided as used in the study. -> ARFF files are generated with Raw Frequency of terms rather than used Weighting Schemes for All_Products and Only_Price_Having_Products. The reason is, we have tested these datasets with only our system and since our system does incremental clustering, even if provide TF-IDF weightings, they wouldn't be same as used in the article. More information provided in the article. ->-> For Macro_Average_Datasets we provide both Raw frequency and TF-IDF scheme weightings as used in the experiments
-> There are 3 main folders -> All_Products: This folder contains 1800 products. ->-> This is the entire collection that is manually labeled. ->-> They are from 250 different classes. -> Only_Price_Having_Products: This folder contains all of the products that have the price feature set. ->-> The collection has 1721 products from 250 classes. ->-> This is the dataset that we have experimented. -> Macro_Average_Datasets: This folder contains 100 datasets that we have used to conduct more reliable experiments. ->-> Each dataset is composed of selecting 1000 different products from the price having products dataset and then randomly ordering them...
- d
Resolving ambiguity of concatenation in multi-locus sequence data for the...
- search.dataone.org
- data-staging.niaid.nih.gov
- +2more
Updated Jun 25, 2025ShareFacebookTwitterEmailClick to copy linkLink copiedCiteAlfried P. Vogler; Douglas Chesters (2025). Resolving ambiguity of concatenation in multi-locus sequence data for the construction of phylogenetic supermatrices [Dataset]. http://doi.org/10.5061/dryad.qp367Unique identifierhttps://doi.org/10.5061/dryad.qp367Dataset updatedJun 25, 2025Dataset provided byDryad Digital RepositoryAuthorsAlfried P. Vogler; Douglas ChestersTime period coveredJan 1, 2013DescriptionThe construction of supermatrices from mining of DNA metadata is problematic due to incomplete species identification and incongruence of gene trees that hamper sequence concatenation based on Linnaean binomials. We applied methods from graph theory to minimize ambiguity of concatenation globally over a large data set. An initial step establishes sequence clusters for each locus that broadly correspond to Linnaean species. These clusters frequently are not consistent with binomials and specimen identifiers, which greatly complicates the concatenation of clusters across multiple loci. A multipartite heuristic algorithm is used to match clusters across loci and to generate a global set of concatenates that minimizes conflict of taxonomic names. The procedure was applied to all available data on GenBank for the Coleoptera (beetles) including >10500 taxon labels for >23500 sequences of four loci. The BlastClust algorithm was used in the initial clustering step, resulting in 11241 clus...
Supplementary Table S1 - A new classification system of beer categories and...
- zenodo.org
txtUpdated May 23, 2025ShareFacebookTwitterEmailClick to copy linkLink copiedCiteDiego Bonatto; Diego Bonatto (2025). Supplementary Table S1 - A new classification system of beer categories and styles based on large-scale data mining and self-organizing maps of beer recipes [Dataset]. http://doi.org/10.5281/zenodo.15498451txtAvailable download formatsUnique identifierhttps://doi.org/10.5281/zenodo.15498451Dataset updatedMay 23, 2025AuthorsDiego Bonatto; Diego BonattoLicenseAttribution 4.0 (CC BY 4.0)https://creativecommons.org/licenses/by/4.0/
License information was derived automaticallyDescriptionA dataset containing raw beer recipe data obtained from Brewer's Friend. The dataset contains malt, hops, adjunct types and quantities, and recipe vital statistics [alcohol by volume (ABV), beer color in the standard reference method (SRM), standard gravity (SG), final gravity (FG), international bitterness units (IBUs), and hop usage]. In addition, beer category information and the country or geographical area from which they originated, combined with supercluster and cluster data, were added to each beer recipe.
Student Performance and Learning Behavior Dataset
- kaggle.com
zipUpdated Sep 4, 2025+ more versionsShareFacebookTwitterEmailClick to copy linkLink copiedCiteAdil Shamim (2025). Student Performance and Learning Behavior Dataset [Dataset]. https://www.kaggle.com/datasets/adilshamim8/student-performance-and-learning-stylezip(78897 bytes)Available download formatsDataset updatedSep 4, 2025AuthorsAdil ShamimLicenseAttribution 4.0 (CC BY 4.0)https://creativecommons.org/licenses/by/4.0/
License information was derived automaticallyDescriptionThis dataset provides a comprehensive view of student performance and learning behavior, integrating academic, demographic, behavioral, and psychological factors.
It was created by merging two publicly available Kaggle datasets, resulting in a unified dataset of 14,003 student records with 16 attributes. All entries are anonymized, with no personally identifiable information.
Key Features
- Study behaviors & engagement →
StudyHours,Attendance,Extracurricular,AssignmentCompletion,OnlineCourses,Discussions - Resources & environment →
Resources,Internet,EduTech - Motivation & psychology →
Motivation,StressLevel - Demographics →
Gender,Age(18–30 years) - Learning preference →
LearningStyle - Performance indicators →
ExamScore,FinalGrade
Objectives & Use Cases
The dataset can be used for:
- Predictive modeling → Regression/classification of student performance (
ExamScore,FinalGrade) - Clustering analysis → Identifying learning behavior groups with K-Means or other unsupervised methods
- Educational analytics → Exploring how study habits, stress, and motivation affect outcomes
- Adaptive learning research → Linking behavioral patterns to personalized learning pathways
Analysis Pipeline (from original study)
The dataset was analyzed in Python using:
- Preprocessing → Encoding, normalization (z-score, Min–Max), deduplication
- Clustering → K-Means, Elbow Method, Silhouette Score, Davies–Bouldin Index
- Dimensionality Reduction → PCA (2D/3D visualizations)
- Statistical Analysis → ANOVA, regression for group differences
- Interpretation → Mapping clusters to
LearningStylecategories & extracting insights for adaptive learning
File
merged_dataset.csv→ 14,003 rows × 16 columns Includes student demographics, behaviors, engagement, learning styles, and performance indicators.
Provenance
- Source: Zenodo – Student Performance and Learning Behavior Dataset
- Creator: Kamal Najem (2024)
- License: CC BY 4.0 (per Zenodo terms)
This dataset is an excellent playground for educational data mining — from clustering and behavioral analytics to predictive modeling and personalized learning applications.
- u
Association analysis of high-high cluster road intersection crashes within...
- zivahub.uct.ac.za
xlsxUpdated Jun 7, 2024+ more versionsShareFacebookTwitterEmailClick to copy linkLink copiedCiteSimone Vieira; Simon Hull; Roger Behrens (2024). Association analysis of high-high cluster road intersection crashes within the CoCT in 2017, 2018, 2019 and 2021 [Dataset]. http://doi.org/10.25375/uct.25975285.v2xlsxAvailable download formatsUnique identifierhttps://doi.org/10.25375/uct.25975285.v2Dataset updatedJun 7, 2024Dataset provided byUniversity of Cape TownAuthorsSimone Vieira; Simon Hull; Roger BehrensLicenseAttribution 4.0 (CC BY 4.0)https://creativecommons.org/licenses/by/4.0/
License information was derived automaticallyArea coveredCity of Cape TownDescriptionThis dataset provides comprehensive information on road intersection crashes recognised as "high-high" clusters within the City of Cape Town. It includes detailed records of all intersection crashes and their corresponding crash attribute combinations, which were prevalent in at least 5% of the total "high-high" cluster road intersection crashes for the years 2017, 2018, 2019, and 2021. The dataset is meticulously organised according to support metric values, ranging from 0,05 to 0,0235, with entries presented in descending order.Data SpecificsData Type: Geospatial-temporal categorical dataFile Format: Excel document (.xlsx)Size: 499 KBNumber of Files: The dataset contains a total of 7186 association rulesDate Created: 23rd May 2024MethodologyData Collection Method: The descriptive road traffic crash data per crash victim involved in the crashes was obtained from the City of Cape Town Network InformationSoftware: ArcGIS Pro, PythonProcessing Steps: Following the spatio-temporal analyses and the derivation of "high-high" cluster fishnet grid cells from a cluster and outlier analysis, all the road intersection crashes that occurred within the "high-high" cluster fishnet grid cells were extracted to be processed by association analysis. The association analysis of these crashes was processed using Python software and involved the use of a 0,05 support metric value. Consequently, commonly occurring crash attributes among at least 5% of the "high-high" cluster road intersection crashes were extracted for inclusion in this dataset.Geospatial InformationSpatial Coverage:West Bounding Coordinate: 18°20'EEast Bounding Coordinate: 19°05'ENorth Bounding Coordinate: 33°25'SSouth Bounding Coordinate: 34°25'SCoordinate System: South African Reference System (Lo19) using the Universal Transverse Mercator projectionTemporal InformationTemporal Coverage:Start Date: 01/01/2017End Date: 31/12/2021 (2020 data omitted)
- m
Fuzzy forms of the rand , adjusted rand and jaccard indices for fuzzy...
- bridges.monash.edu
pdfUpdated Nov 21, 2017ShareFacebookTwitterEmailClick to copy linkLink copiedCiteBrouwer, Roelof K. (2017). Fuzzy forms of the rand , adjusted rand and jaccard indices for fuzzy partitions of gene expression and other data [Dataset]. http://doi.org/10.4225/03/5a137217eabd8pdfAvailable download formatsUnique identifierhttps://doi.org/10.4225/03/5a137217eabd8Dataset updatedNov 21, 2017Dataset provided byMonash UniversityAuthorsBrouwer, Roelof K.Licensehttp://rightsstatements.org/vocab/InC/1.0/http://rightsstatements.org/vocab/InC/1.0/
DescriptionClustering is one of the most basic processes that are performed in simplifying data and expressing knowledge in a scientific endeavor. Clustering algorithms have been proposed for the analysis of gene expression data with little guidance available to help choose among them however. Since the output of clustering is a partition of the input data, the quality of the partition must be determined. This paper presents fuzzy extensions to some commonly used clustering measures including the rand index (RI), adjusted rand index(ARI) and the jaccard index(JI) that are already defined for crisp clustering. Fuzzy clustering, and therefore fuzzy cluster indices, is beneficial since it provides more realistic cluster memberships for the objects that are clustered rather than 0 or 1 values. If a crisp partition is still desired the fuzzy partition can be turned in to a crisp partition in an obvious manner. The usefulness of the fuzzy clustering in that case is that it processes noise better. These new indices proposed in this paper, called FRI, FARI, and FJI for fuzzy clustering, give the same values as the original indices do in the special case of crisp clustering. Through use in fuzzy clustering of artificial data and real data, including gene expression data, the effectiveness of the indices is demonstrated. PRIB 2008 proceedings found at: http://dx.doi.org/10.1007/978-3-540-88436-1
Contributors: Monash University. Faculty of Information Technology. Gippsland School of Information Technology ; Chetty, Madhu ; Ahmad, Shandar ; Ngom, Alioune ; Teng, Shyh Wei ; Third IAPR International Conference on Pattern Recognition in Bioinformatics (PRIB) (3rd : 2008 : Melbourne, Australia) ; Coverage: Rights: Copyright by Third IAPR International Conference on Pattern Recognition in Bioinformatics. All rights reserved.
- Z
Data from: Zero-shot Bilingual App Reviews Mining with Large Language Models...
- data.niaid.nih.gov
Updated May 23, 2024ShareFacebookTwitterEmailClick to copy linkLink copiedCiteWei, Jialiang; Courbis, Anne-Lise; Lambolais, Thomas; Xu, Binbin; Bernard, Pierre Louis; Dray, Gérard (2024). Zero-shot Bilingual App Reviews Mining with Large Language Models [Dataset]. https://data.niaid.nih.gov/resources?id=zenodo_11066414Dataset updatedMay 23, 2024Dataset provided byEuroMov Digital Health in Motion, Univ Montpellier, IMT Mines Ales, Ales, France
EuroMov Digital Health in Motion, Univ Montpellier, IMT Mines Ales, Montpellier, FranceAuthorsWei, Jialiang; Courbis, Anne-Lise; Lambolais, Thomas; Xu, Binbin; Bernard, Pierre Louis; Dray, GérardLicenseMIT Licensehttps://opensource.org/licenses/MIT
License information was derived automaticallyDescriptionClassification
6000 English and 6000 French user reviews from three applications on Google Play (Garmin Connect, Huawei Health, Samsung Health) are labelled manually. We employed three labels: problem report, feature request, and irrelevant.
Problem reports show the issues the users have experienced while using the app.
Feature requests reflect the demande of users on new function, new content, new interface, etc.
Irrelevant are the user reviews that do not belongs to the two aforementioned categories.
As we can observe from the following table, that shows examples of labelled user reviews, each review belongs to one or more categories.
App Language Total Feature request Problem report Irrelevant
Garmin Connect en 2000 223 579 1231
Garmin Connect fr 2000 217 772 1051
Huawei Health en 2000 415 876 764
Huawei Health fr 2000 387 842 817
Samsung Health en 2000 528 500 990
Samsung Health fr 2000 496 492 1047
Clustering
1200 bilingual labeled user reviews for clustering evaluation. From each of the three applications and for each of the two languages present in the classification dataset, we randomly selected 100 problem reports and 100 feature requests. Subsequently, we conducted manual clustering on each collection of 200 bilingual reviews, all of which pertained to the same category.
Garmin Connect Huawei Health Samsung Health
clusters in feature request
89 74 69
clusters(𝑠𝑖𝑧𝑒≥5) in feature request
7 9 11
clusters in problem report
45 44 41
clusters(𝑠𝑖𝑧𝑒≥5) in problem report
10 13 12
- N
An investigation of the structural, connectional, and functional...
- neurovault.org
niftiUpdated Jun 30, 2018+ more versionsShareFacebookTwitterEmailClick to copy linkLink copiedCite(2018). An investigation of the structural, connectional, and functional subspecialization in the human amygdala: Figure 3 - Left Amygdala (cluster #2) [Dataset]. http://identifiers.org/neurovault.image:12011niftiAvailable download formatsUnique identifierhttps://identifiers.org/neurovault.image:12011Dataset updatedJun 30, 2018LicenseCC0 1.0 Universal Public Domain Dedicationhttps://creativecommons.org/publicdomain/zero/1.0/
License information was derived automaticallyDescriptionConnectivity-based parcellation (CBP) of the left human amygdala. Cluster #2 (green) - superficial nuclei group
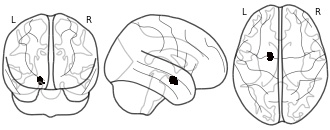
Collection description
We here employed methods for large-scale data mining to perform a connectivity-derived parcellation of the human amygdala based on whole-brain coactivation patterns computed for each seed voxel. Using this approach, connectivity-based parcellation divided the amygdala into three distinct clusters that are highly consistent with earlier microstructural distinctions. Meta-analytic connectivity modelling and functional characterization further revealed that the amygdala's laterobasal nuclei group was associated with coordinating high-level sensory input, whereas its centromedial nuclei group was linked to mediating attentional, vegetative, and motor responses. The results of this model-free approach support the concordance of structural, connectional, and functional organization in the human amygdala. This dataset was automatically imported from the ANIMA <http://anima.modelgui.org/> database. Version: 1
Subject species
homo sapiens
Modality
fMRI-BOLD
Analysis level
meta-analysis
Cognitive paradigm (task)
None / Other
Map type
M
- u
Association analysis of high-high cluster road intersection crashes...
- zivahub.uct.ac.za
xlsxUpdated Jun 7, 2024+ more versionsShareFacebookTwitterEmailClick to copy linkLink copiedCiteSimone Vieira; Simon Hull; Roger Behrens (2024). Association analysis of high-high cluster road intersection crashes involving motorcycles that resulted in injuries within the CoCT in 2017, 2018, 2019 and 2021 [Dataset]. http://doi.org/10.25375/uct.25975825.v1xlsxAvailable download formatsUnique identifierhttps://doi.org/10.25375/uct.25975825.v1Dataset updatedJun 7, 2024Dataset provided byUniversity of Cape TownAuthorsSimone Vieira; Simon Hull; Roger BehrensLicenseAttribution 4.0 (CC BY 4.0)https://creativecommons.org/licenses/by/4.0/
License information was derived automaticallyArea coveredCity of Cape TownDescriptionThis dataset provides comprehensive information on road intersection crashes involving motorcycles (Motor tricycle, Motorcycle: under 125cc, Motorcycle: Above 125cc, Quadru-cycle) that have resulted in injuries recognised as "high-high" clusters within the City of Cape Town. It includes detailed records of all intersection crashes and their corresponding crash attribute combinations, which were prevalent in 33% of the total "high-high" cluster motorcycle road intersection crashes resulting in injuries for the years 2017, 2018, 2019, and 2021. Data SpecificsData Type: Geospatial-temporal categorical dataFile Format: Excel document (.xlsx)Size: 37,4 KBNumber of Files: The dataset contains a total of 576 association rulesDate Created: 23rd May 2024MethodologyData Collection Method: The descriptive road traffic crash data per crash victim involved in the crashes was obtained from the City of Cape Town Network InformationSoftware: ArcGIS Pro, PythonProcessing Steps: Following the spatio-temporal analyses and the derivation of "high-high" cluster fishnet grid cells from a cluster and outlier analysis, all the road intersection crashes involving a motorcycle resulting in injuries that occurred within the "high-high" cluster fishnet grid cells were extracted to be processed by association analysis. The association analysis of the "high-high" cluster road intersection motorcycle crashes was processed using Python software and involved the use of a 0,30 support metric value. Consequently, commonly occurring crash attributes among at least 33% of the "high-high" cluster road intersection motorcycle crashes resulting in injuries were extracted for inclusion in this dataset.Geospatial InformationSpatial Coverage:West Bounding Coordinate: 18°20'EEast Bounding Coordinate: 19°05'ENorth Bounding Coordinate: 33°25'SSouth Bounding Coordinate: 34°25'SCoordinate System: South African Reference System (Lo19) using the Universal Transverse Mercator projectionTemporal InformationTemporal Coverage:Start Date: 01/01/2017End Date: 31/12/2021 (2020 data omitted)
- u
Association analysis of high-high cluster road intersection pedestrian...
- zivahub.uct.ac.za
xlsxUpdated Jun 7, 2024+ more versionsShareFacebookTwitterEmailClick to copy linkLink copiedCiteSimone Vieira; Simon Hull; Roger Behrens (2024). Association analysis of high-high cluster road intersection pedestrian crashes within the CoCT in 2017, 2018, 2019 and 2021 [Dataset]. http://doi.org/10.25375/uct.25976263.v1xlsxAvailable download formatsUnique identifierhttps://doi.org/10.25375/uct.25976263.v1Dataset updatedJun 7, 2024Dataset provided byUniversity of Cape TownAuthorsSimone Vieira; Simon Hull; Roger BehrensLicenseAttribution 4.0 (CC BY 4.0)https://creativecommons.org/licenses/by/4.0/
License information was derived automaticallyArea coveredCity of Cape TownDescriptionThis dataset provides comprehensive information on road intersection pedestrian crashes recognised as "high-high" clusters within the City of Cape Town. It includes detailed records of all intersection crashes and their corresponding crash attribute combinations, which were prevalent in at least 10% of the total "high-high" cluster pedestrian road intersection crashes for the years 2017, 2018, 2019, and 2021.The dataset is meticulously organised according to support metric values, ranging from 0,10 to 0,13, with entries presented in descending order.Data SpecificsData Type: Geospatial-temporal categorical dataFile Format: Excel document (.xlsx)Size: 15,0 KBNumber of Files: The dataset contains a total of 162 association rulesDate Created: 24th May 2024MethodologyData Collection Method: The descriptive road traffic crash data per crash victim involved in the crashes was obtained from the City of Cape Town Network InformationSoftware: ArcGIS Pro, PythonProcessing Steps: Following the spatio-temporal analyses and the derivation of "high-high" cluster fishnet grid cells from a cluster and outlier analysis, all the road intersection pedestrian crashes that occurred within the "high-high" cluster fishnet grid cells were extracted to be processed by association analysis. The association analysis of these crashes was processed using Python software and involved the use of a 0,10 support metric value. Consequently, commonly occurring crash attributes among at least 10% of the "high-high" cluster road intersection pedestrian crashes were extracted for inclusion in this dataset.Geospatial InformationSpatial Coverage:West Bounding Coordinate: 18°20'EEast Bounding Coordinate: 19°05'ENorth Bounding Coordinate: 33°25'SSouth Bounding Coordinate: 34°25'SCoordinate System: South African Reference System (Lo19) using the Universal Transverse Mercator projectionTemporal InformationTemporal Coverage:Start Date: 01/01/2017End Date: 31/12/2021 (2020 data omitted)
- D
Heavy Equipment Instrument Cluster Market Research Report 2033
- dataintelo.com
csv, pdf, pptxUpdated Sep 30, 2025+ more versionsShareFacebookTwitterEmailClick to copy linkLink copiedCiteDataintelo (2025). Heavy Equipment Instrument Cluster Market Research Report 2033 [Dataset]. https://dataintelo.com/report/heavy-equipment-instrument-cluster-marketpdf, csv, pptxAvailable download formatsDataset updatedSep 30, 2025Dataset authored and provided byDatainteloLicensehttps://dataintelo.com/privacy-and-policyhttps://dataintelo.com/privacy-and-policy
Time period covered2024 - 2032Area coveredGlobalDescriptionHeavy Equipment Instrument Cluster Market Outlook
According to our latest research, the global Heavy Equipment Instrument Cluster market size in 2024 is valued at USD 2.85 billion, reflecting robust demand across multiple industrial sectors. The market is witnessing a Compound Annual Growth Rate (CAGR) of 6.2% through the forecast period. By 2033, the Heavy Equipment Instrument Cluster market is projected to reach USD 4.90 billion. This growth is primarily driven by rapid technological advancements, increasing automation in heavy equipment, and the rising demand for enhanced operator safety and productivity. As per our latest research, the market’s upward trajectory underscores its pivotal role in the modernization of construction, agricultural, mining, and material handling machinery worldwide.
A significant growth factor for the Heavy Equipment Instrument Cluster market is the accelerated adoption of digitalization in the heavy machinery sector. Modern construction, agricultural, and mining equipment manufacturers are increasingly integrating advanced digital instrument clusters to provide real-time data visualization, operational insights, and diagnostic information. These digital clusters offer superior readability, customizable interfaces, and seamless connectivity with telematics and fleet management systems, which are essential for optimizing equipment utilization, minimizing downtime, and ensuring regulatory compliance. As heavy equipment becomes more complex and technologically sophisticated, the demand for intuitive, robust, and user-friendly instrument clusters continues to surge, propelling market expansion.
Another key driver is the growing emphasis on operator safety and comfort. Instrument clusters play a crucial role in delivering critical machine status updates, alerts, and performance metrics directly to operators, enabling them to make informed decisions and respond promptly to potential hazards. Enhanced safety regulations, particularly in mining and construction sectors, are compelling OEMs and fleet operators to invest in advanced instrument clusters equipped with features such as warning indicators, maintenance reminders, and environmental monitoring. Furthermore, the integration of ergonomic design and high-resolution displays in instrument clusters is improving operator comfort, reducing fatigue, and boosting overall productivity, thereby contributing to the sustained growth of the Heavy Equipment Instrument Cluster market.
The ongoing shift towards electrification and hybridization of heavy equipment is also fueling market growth. As the industry pivots to more sustainable and energy-efficient machinery, instrument clusters are evolving to support new functionalities, such as battery management, energy consumption monitoring, and hybrid system diagnostics. This transition is particularly evident in regions with stringent emission regulations and strong governmental support for green technologies. The need for precise and comprehensive data visualization in electric and hybrid heavy equipment is creating fresh opportunities for instrument cluster manufacturers to innovate and differentiate their offerings, further accelerating market development.
From a regional perspective, Asia Pacific stands out as the dominant market, driven by large-scale infrastructure projects, rapid urbanization, and the presence of leading heavy equipment manufacturers. North America and Europe are also significant contributors, supported by technological innovation and high adoption rates of advanced machinery. The Middle East & Africa and Latin America are experiencing steady growth, primarily due to increasing investments in mining and construction activities. Regional dynamics, including regulatory frameworks, economic development, and technological adoption rates, are shaping the competitive landscape and influencing the growth trajectory of the Heavy Equipment Instrument Cluster market globally.Product Type Analysis
The Product Type segment of the Heavy Equipment Instrument Cluster market is categorized into Digital Instrument Cluster, Analog Instrument Cluster, and Hybrid Instrument Cluster. The digital instrument cluster segment is experiencing the fastest growth, attributed to its ability to provide dynamic, customizable, and interactive displays. Digital clusters are increasingly preferred for their seamless integration with advanced telematics, GPS na Performance of STC with the best result for single-view and each type of...
- plos.figshare.com
xlsUpdated Aug 23, 2024ShareFacebookTwitterEmailClick to copy linkLink copiedCiteMajid Hameed Ahmed; Sabrina Tiun; Nazlia Omar; Nor Samsiah Sani (2024). Performance of STC with the best result for single-view and each type of MVRs on the StackOverflow dataset. [Dataset]. http://doi.org/10.1371/journal.pone.0309206.t004xlsAvailable download formatsUnique identifierhttps://doi.org/10.1371/journal.pone.0309206.t004Dataset updatedAug 23, 2024AuthorsMajid Hameed Ahmed; Sabrina Tiun; Nazlia Omar; Nor Samsiah SaniLicenseAttribution 4.0 (CC BY 4.0)https://creativecommons.org/licenses/by/4.0/
License information was derived automaticallyDescriptionPerformance of STC with the best result for single-view and each type of MVRs on the StackOverflow dataset.
- u
Association analysis of high-low outlier unsignalled road intersection...
- zivahub.uct.ac.za
xlsxUpdated Jun 7, 2024+ more versionsShareFacebookTwitterEmailClick to copy linkLink copiedCiteSimone Vieira; Simon Hull; Roger Behrens (2024). Association analysis of high-low outlier unsignalled road intersection crashes within the CoCT in 2017, 2018 and 2019 [Dataset]. http://doi.org/10.25375/uct.25982002.v1xlsxAvailable download formatsUnique identifierhttps://doi.org/10.25375/uct.25982002.v1Dataset updatedJun 7, 2024Dataset provided byUniversity of Cape TownAuthorsSimone Vieira; Simon Hull; Roger BehrensLicenseAttribution 4.0 (CC BY 4.0)https://creativecommons.org/licenses/by/4.0/
License information was derived automaticallyArea coveredCity of Cape TownDescriptionThis dataset provides comprehensive information on unsignalled road intersection crashes recognised as "high-low" clusters within the City of Cape Town. It includes detailed records of all intersection crashes and their corresponding crash attribute combinations, which were prevalent in at least 10% of the total "high-high" cluster unsignalled road intersection crashes resulting for the years 2017, 2018 and 2019. The dataset is meticulously organised according to support metric values, ranging from 0,10 to 0,223, with entries presented in descending order.Data SpecificsData Type: Geospatial-temporal categorical dataFile Format: Excel document (.xlsx)Size: 57,4 KB Number of Files: The dataset contains a total of 1050 association rulesDate Created: 24th May 2024MethodologyData Collection Method: The descriptive road traffic crash data per crash victim involved in the crashes was obtained from the City of Cape Town Network InformationSoftware: ArcGIS Pro, PythonProcessing Steps: Following the spatio-temporal analyses and the derivation of "high-low" outlier fishnet grid cells from a cluster and outlier analysis, all the unsignalled road intersection crashes that occurred within the "high-low" outlier fishnet grid cells were extracted to be processed by association analysis. The association analysis of these crashes was processed using Python software and involved the use of a 0,05 support metric value. Consequently, commonly occurring crash attributes among at least 10% of the "high-low" outlier unsignalled road intersection crashes were extracted for inclusion in this dataset.Geospatial InformationSpatial Coverage:West Bounding Coordinate: 18°20'EEast Bounding Coordinate: 19°05'ENorth Bounding Coordinate: 33°25'SSouth Bounding Coordinate: 34°25'SCoordinate System: South African Reference System (Lo19) using the Universal Transverse Mercator projectionTemporal InformationTemporal Coverage:Start Date: 01/01/2017End Date: 31/12/2019
FacebookTwitterEducational Attainment in North Carolina Public Schools: Use of statistical modeling, data mining techniques, and machine learning algorithms to explore 2014-2017 North Carolina Public School datasets.
Attribution 4.0 (CC BY 4.0)https://creativecommons.org/licenses/by/4.0/
License information was derived automatically
The purpose of data mining analysis is always to find patterns of the data using certain kind of techiques such as classification or regression. It is not always feasible to apply classification algorithms directly to dataset. Before doing any work on the data, the data has to be pre-processed and this process normally involves feature selection and dimensionality reduction. We tried to use clustering as a way to reduce the dimension of the data and create new features. Based on our project, after using clustering prior to classification, the performance has not improved much. The reason why it has not improved could be the features we selected to perform clustering are not well suited for it. Because of the nature of the data, classification tasks are going to provide more information to work with in terms of improving knowledge and overall performance metrics. From the dimensionality reduction perspective: It is different from Principle Component Analysis which guarantees finding the best linear transformation that reduces the number of dimensions with a minimum loss of information. Using clusters as a technique of reducing the data dimension will lose a lot of information since clustering techniques are based a metric of 'distance'. At high dimensions euclidean distance loses pretty much all meaning. Therefore using clustering as a "Reducing" dimensionality by mapping data points to cluster numbers is not always good since you may lose almost all the information. From the creating new features perspective: Clustering analysis creates labels based on the patterns of the data, it brings uncertainties into the data. By using clustering prior to classification, the decision on the number of clusters will highly affect the performance of the clustering, then affect the performance of classification. If the part of features we use clustering techniques on is very suited for it, it might increase the overall performance on classification. For example, if the features we use k-means on are numerical and the dimension is small, the overall classification performance may be better. We did not lock in the clustering outputs using a random_state in the effort to see if they were stable. Our assumption was that if the results vary highly from run to run which they definitely did, maybe the data just does not cluster well with the methods selected at all. Basically, the ramification we saw was that our results are not much better than random when applying clustering to the data preprocessing. Finally, it is important to ensure a feedback loop is in place to continuously collect the same data in the same format from which the models were created. This feedback loop can be used to measure the model real world effectiveness and also to continue to revise the models from time to time as things change.