Voting intention in the United Kingdom 2025, by age
- statista.com
Updated Jul 8, 2025 Share
Share Facebook
 Twitter
 EmailClick to copy linkLink copiedCiteStatista (2025). Voting intention in the United Kingdom 2025, by age [Dataset]. https://www.statista.com/statistics/1379439/uk-election-polls-by-age/Dataset updatedJul 8, 2025Time period coveredJul 6, 2025 - Jul 7, 2025Area coveredUnited KingdomDescription
As of July 2025, the political party that 18 to 24 year-old's in Great Britain would be most likely to vote for was the Labour Party, at 33 percent, with Labour also the most popular party among those aged 25 to 49. Reform UK was the most popular party for the 50 to 64 age group, with 29 percent of voters saying they would vote for them. For the oldest age group, the Reform was also the most popular, with 35 percent of over 65s intending to vote for them. Reform surge in the polls Since winning the last UK general election in July 2024, the ruling Labour Party have steadily become more unpopular among voters. After winning 33.7 percent of the vote in that election, the party was polling at 24 percent in April 2025, only slightly ahead of Reform UK on 23 percent. A right-wing populist party, Reform benefited from the collapse in support for the center-right Conservative Party in the last election, winning several seats at their expense. While the next UK general election is not due to be held until 2029, the government will be keen to address their collapsing approval ratings, in the face of Reform's rising support. Economic headaches for Labour in 2025 Although Labour inherited a growing economy, with falling inflation, and low unemployment from the Conservatives, the overall economic outlook for the UK is still quite gloomy. The country's government debt is around 100 percent of GDP, and without large tax rises and spending cuts, the government hopes to create a stronger, more resilient economy to reduce the deficit. While this is still a possibility, the UK's economic prospects for 2025 were recently slashed, with growth of one percent forecast, down from an earlier prediction of two percent. Although mainly due to external factors such as the threat of increasing tariffs, and general geopolitical instability, the UK's faltering economy will add further problems to the embattled government.
UK Parliamentary Constituency boundaries for the island of Ireland,...
- zenodo.org
binUpdated Oct 25, 2024ShareFacebookTwitterEmailClick to copy linkLink copiedCiteCharlton Martin; Charlton Martin; Eoin McLaughlin; Eoin McLaughlin; Jack Kavanagh; Jack Kavanagh (2024). UK Parliamentary Constituency boundaries for the island of Ireland, 1885-1918 [Dataset]. http://doi.org/10.5281/zenodo.13993331binAvailable download formatsUnique identifierhttps://doi.org/10.5281/zenodo.13993331Dataset updatedOct 25, 2024AuthorsCharlton Martin; Charlton Martin; Eoin McLaughlin; Eoin McLaughlin; Jack Kavanagh; Jack KavanaghLicenseAttribution 4.0 (CC BY 4.0)https://creativecommons.org/licenses/by/4.0/
License information was derived automaticallyTime period covered2017Area coveredIreland, United KingdomDescriptionThe 1885 UK parliamentary constituencies for Ireland were re-created in 2017 as part of a conference paper delivered at the Southern Irish Loyalism in Context conference at Maynooth University. The intial map only included the territory of the Irish Free State and was created by Martin Charlton and Jack Kavanagh. The remaining six counties of Ulster were completed by Eoin McLaughlin in 2018-19, the combined result is a GIS map of all the parliamentary constituecies across the island of Ireland for the period 1885-1918. The map is available in both ESRI Shapefile format and as a GeoPackage (GPKG). The methodology for creating the constituencies is outlined in detail below.
Methodology
A map showing the outlines of the 1855 – 1918 Constituency boundaries can be found on page 401 of Parliamentary Elections in Ireland, 1801-1922 (Dublin, 1978) by Brian Walker. This forms the basis for the creation of a set of digital boundaries which can then be used in a GIS. The general workflow involves allocating an 1885 Constituency identifier to each of the 309 Electoral Divisions present in the boundaries made available for the 2011 Census of Population data release by CSO. The ED boundaries are available in ‘shapefile’ format (a de facto standard for spatial data transfer). Once a Constituency identifier has been given to each ED, the GIS operation known as ‘dissolve’ is used to remove the boundaries between EDs in the same Constituency. To begin with Walker’s map was scanned at 1200 dots per inch in JPEG form. A scanned map cannot be linked to other spatial data without undergoing a process known as georeferencing. The CSO boundaries are available with spatial coordinates in the Irish National Grid system. The goal of georeferencing is to produce a rectified version of the map together with a world file. Rectification refers to the process of recomputing the pixel positions in the scanned map so that they are oriented with the ING coordinate system; the world file contains the extent in both the east-west and north-south directions of each pixel (in metres) and the coordinates of the most north-westerly pixel in the rectified image.
Georeferencing involves the identification of Ground Control Points – these are locations on the scanned map for which the spatial coordinates in ING are known. The Georeferencing option in ArcGIS 10.4 makes this a reasonably pain free task. For this map 36 GCPs were required for a local spline transformation. The Redistribution of Seats Act 1885 provides the legal basis for the constituencies to be used for future elections in England, Wales, Scotland and Ireland. Part III of the Seventh Schedule of the Act defines the Constituencies in terms of Baronies, Parishes (and part Parishes) and Townlands for Ireland. Part III of the Sixth Schedule provides definitions for the Boroughs of Belfast and Dublin.
The CSO boundary collection also includes a shapefile of Barony boundaries. This makes it possible code a barony in two ways: (i) allocated completely to a Division or (ii) split between two Divisions. For the first type, the code is just the division name, and for the second the code includes both (or more) division names. Allocation of these names to the data in the ED shapefile is accomplished by a spatial join operation. Recoding the areas in the split Baronies is done interactively using the GIS software’s editing option. EDs or groups of EDs can be selected on the screen, and the correct Division code updated in the attribute table. There are a handful of cases where an ED is split between divisions, so a simple ‘majority’ rule was used for the allocation. As the maps are to be used at mainly for displaying data at the national level, a misallocation is unlikely to be noticed. The final set of boundaries was created using the dissolve operation mentioned earlier. There were a dozen ED that had initially escaped being allocated a code, but these were quickly updated. Similarly, a few of the EDs in the split divisions had been overlooked; again updating was painless. This meant that the dissolve had to be run a few more times before all the errors have been corrected.
For the Northern Ireland districts, a slightly different methodology was deployed which involved linking parishes and townlands along side baronies, using open data sources from the OSM Townlands.ie project and OpenData NI.
General Election Results 2015
- data.wu.ac.at
csv, html, xlsUpdated Mar 15, 2018+ more versionsShareFacebookTwitterEmailClick to copy linkLink copiedCiteGreater London Authority (GLA) (2018). General Election Results 2015 [Dataset]. https://data.wu.ac.at/schema/data_gov_uk/ODNjYmEyZGUtYjk2Ny00MDhlLThkYWEtMzVlNjFkZWU5Yjg1csv, xls, htmlAvailable download formatsDataset updatedMar 15, 2018DescriptionThe results for each candidate standing in all 73 seats in Greater London are available as an Excel file. The data is also presented as an interactive map below. The files includes election results from the last three parliamentary constituency elections between 2005 to 2015. The results presented here include turnout, majority and percentage of vote for each candidate that stood in the election that took place on 7 May 2015. Read the blog, The 2015 election – the numbers behind the result, which analyses some of the results. London Maps The London data is presented in this interactive Instant Atlas report. UK Maps Some interactive maps of the UK results have been created using Tableau.
- s
Counties and Unitary Authorities (April 2023) Map in the UK
- geoportal.statistics.gov.uk
- hub.arcgis.com
Updated May 31, 2023+ more versionsShareFacebookTwitterEmailClick to copy linkLink copiedCiteOffice for National Statistics (2023). Counties and Unitary Authorities (April 2023) Map in the UK [Dataset]. https://geoportal.statistics.gov.uk/documents/1aa806eb35ee4334a87f5970c82e3ac0Dataset updatedMay 31, 2023Dataset authored and provided byOffice for National StatisticsLicensehttps://www.ons.gov.uk/methodology/geography/licenceshttps://www.ons.gov.uk/methodology/geography/licences
Area coveredDescriptionA PDF map that shows the counties and unitary authorities in the United Kingdom as at 1 April 2023. (File Size - 583 KB)
- e
Political Communication: Mapping Free Trade, 1910 - Dataset - B2FIND
- b2find.eudat.eu
Updated Oct 23, 2023ShareFacebookTwitterEmailClick to copy linkLink copiedCite(2023). Political Communication: Mapping Free Trade, 1910 - Dataset - B2FIND [Dataset]. https://b2find.eudat.eu/dataset/8eebdbb9-4d75-5a95-8168-5b932d88bd28Dataset updatedOct 23, 2023DescriptionAbstract copyright UK Data Service and data collection copyright owner. In the years before World War One, Free Trade was a crucial part of British culture. Yet we know little about it as a form of political communication. This has been partly because the records of the Free Trade Union did not survive, partly because until recently most historians were more interested in political leaders than political culture. The so-called Free Trade Lectures organisation, which was active throughout 1910, was a self-conscious exercise in modernising how political economy was communicated to different sections of the population. Main Topics: This study maps the activities of the Free Trade Lectures organisation, which was active throughout 1910. These included well over a thousand lectures, exhibitions, and lantern slides. Activities are listed separately by town and village as well as by type, distinguishing activities for women, general audiences, rural audiences, and special trades. The list of voluntary and paid speakers gives names separately. All maps and tables are based on the reported activities by the National Free Trade Lectures organisation only and do not include the work of other organisations, such as the Free Trade Union, where detailed information has not survived. Please note: this study does not include information on named individuals and would therefore not be useful for personal family history research.
- K
United Kingdom Polling District Boundaries (England)
- koordinates.com
csv, dwg, geodatabase +6Updated Sep 12, 2023ShareFacebookTwitterEmailClick to copy linkLink copiedCiteOrdnance Survey (OS) (2023). United Kingdom Polling District Boundaries (England) [Dataset]. https://koordinates.com/layer/114457-united-kingdom-polling-district-boundaries-england/kml, pdf, shapefile, dwg, geopackage / sqlite, csv, geodatabase, mapinfo tab, mapinfo mifAvailable download formatsDataset updatedSep 12, 2023AuthorsOrdnance Survey (OS)Licensehttps://koordinates.com/license/open-government-license-3/https://koordinates.com/license/open-government-license-3/
Area coveredDescriptionA polling district is the subdivision of a parliamentary constituency for the purpose of a UK Parliamentary election. Polling districts are not maintained on a regular basis and have mostly been frozen since 2016. From May 2022, 63 areas will show amended polling districts.
https://www.ordnancesurvey.co.uk/products/boundary-line#technical
Source:
https://osdatahub.os.uk/downloads/open/BoundaryLine
Licence:
Contains public sector information licensed under the Open Government Licence v3.0.
https://www.nationalarchives.gov.uk/doc/open-government-licence/version/3/
- a
UK Parliament General Election June 2017 (electoral data)
- data-ren.opendata.arcgis.com
- hub.arcgis.com
Updated Jan 9, 2018ShareFacebookTwitterEmailClick to copy linkLink copiedCiteRenfrewshire Council (2018). UK Parliament General Election June 2017 (electoral data) [Dataset]. https://data-ren.opendata.arcgis.com/datasets/1f9c282884ce450f9f32e81402f52f5cDataset updatedJan 9, 2018Dataset authored and provided byRenfrewshire CouncilLicenseOpen Government Licence 3.0http://www.nationalarchives.gov.uk/doc/open-government-licence/version/3/
License information was derived automaticallyArea coveredUnited KingdomDescriptionUK Parliament General Election 8 June 2017 electoral data.
- E
Popple, Henry 1733. A Map of the British Empire in America (Sheet 18)
- ecaidata.org
Updated Oct 4, 2014ShareFacebookTwitterEmailClick to copy linkLink copiedCiteECAI Clearinghouse (2014). Popple, Henry 1733. A Map of the British Empire in America (Sheet 18) [Dataset]. https://ecaidata.org/dataset/ecaiclearinghouse-id-436Dataset updatedOct 4, 2014Dataset provided byECAI ClearinghouseDescriptionHistorical Map of South / Central America from the David Rumsey Historical Map Collection
- K
United Kingdom Civil Parish and Community Boundaries
- koordinates.com
csv, dwg, geodatabase +6Updated Aug 29, 2003+ more versionsShareFacebookTwitterEmailClick to copy linkLink copiedCiteOrdnance Survey (OS) (2003). United Kingdom Civil Parish and Community Boundaries [Dataset]. https://koordinates.com/layer/114431-united-kingdom-civil-parish-and-community-boundaries/csv, dwg, geodatabase, shapefile, pdf, mapinfo mif, geopackage / sqlite, kml, mapinfo tabAvailable download formatsDataset updatedAug 29, 2003AuthorsOrdnance Survey (OS)Licensehttps://koordinates.com/license/open-government-license-3/https://koordinates.com/license/open-government-license-3/
Area coveredDescriptionParishes are subdivisions of local authorities in many parts of England, and their councils are the most local level of government. Unlike electoral wards/divisions however, parishes are not found in all parts of England. The Welsh equivalents are communities. Note that the full term for administrative parishes is 'civil parishes', to distinguish them from the ecclesiastical parishes which are found in all parts of the UK.
https://www.ordnancesurvey.co.uk/products/boundary-line#technical
Source:
https://osdatahub.os.uk/downloads/open/BoundaryLine
Licence:
Contains public sector information licensed under the Open Government Licence v3.0.
https://www.nationalarchives.gov.uk/doc/open-government-licence/version/3/
Westminster Parliamentary Constituencies (July 2024) Boundaries UK BFC
- geoportal.statistics.gov.uk
- hub.arcgis.com
Updated Jun 3, 2024+ more versionsShareFacebookTwitterEmailClick to copy linkLink copiedCiteOffice for National Statistics (2024). Westminster Parliamentary Constituencies (July 2024) Boundaries UK BFC [Dataset]. https://geoportal.statistics.gov.uk/datasets/ons::westminster-parliamentary-constituencies-july-2024-boundaries-uk-bfc-2/aboutDataset updatedJun 3, 2024Licensehttps://www.ons.gov.uk/methodology/geography/licenceshttps://www.ons.gov.uk/methodology/geography/licences
Area coveredDescriptionThis file contains the digital vector boundaries for Westminster Parliamentary Constituencies, in the United Kingdom, as at 4th July 2024.The boundaries available are: (BFC) Full resolution - clipped to the coastline (Mean High Water mark).Contains both Ordnance Survey and ONS Intellectual Property Rights.REST URL of Feature Access Service – https://services1.arcgis.com/ESMARspQHYMw9BZ9/arcgis/rest/services/Westminster_Parliamentary_Constituencies_July_2024_Boundaries_UK_BFC/FeatureServerREST URL of WFS Server –https://dservices1.arcgis.com/ESMARspQHYMw9BZ9/arcgis/services/Westminster_Parliamentary_Constituencies_July_2024_Boundaries_UK_BFC/WFSServer?service=wfs&request=getcapabilitiesREST URL of Map Server –https://services1.arcgis.com/ESMARspQHYMw9BZ9/arcgis/rest/services/Westminster_Parliamentary_Constituencies_July_2024_Boundaries_UK_BFC/MapServer
- e
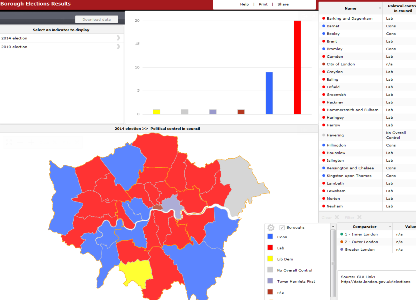
Borough Council Election Results 2014
- data.europa.eu
excel xls, pdfUpdated Dec 1, 2014+ more versionsShareFacebookTwitterEmailClick to copy linkLink copiedCiteGreater London Authority (2014). Borough Council Election Results 2014 [Dataset]. https://data.europa.eu/data/datasets/borough-council-election-results-2014excel xls, pdfAvailable download formatsDataset updatedDec 1, 2014Dataset authored and provided byGreater London AuthorityDescription
This report includes a great deal of detail on every aspect of the 2014 London Borough council general elections. No other single volume presents the full results and election statistics from the 32 London boroughs enabling the reader to analyse and compare the results across London in one place. The report presents data for every candidate in every ward (excluding the City of London which operates on a different electoral model). The report also contains analysis of the European election results for London that took place on the same day.
Printed Copies We are able to accept orders for hard copies £30. Click here for further details.
Details of all previous elections reports in the series can be found here.
Summary results of the 2014 local elections in London, showing number and percentage of seats won, turnout and political control.
Final 2014 ward results
These results show the number of votes for each candidate in each ward in London. Turnout, number of ballots, postal votes, and breakdown of rejected votes, Mayoral and European voting figures are also included where available.
Map showing political control in each ward.
https://londondatastore-upload.s3.amazonaws.com/images/London-ward-map-borough-election-2014-new-colours-small.png" alt="">
Also, using these ward results, Oliver O'Brien from CASA has created some eye catching interactive ward maps.
The borough map shows the summary results in both the 2010 and 2014 elections.
The ward interactive map shows the detailed results for each candidate at ward level for the last three elections between 2006 and 2014.

This motion chart shows the relationship, between share of votes and seats won by the major parties in elections since 1964 at borough level (requires Adobe Flash Player).
 )
) - o
Electoral Wards/Divisions - United Kingdom
- public.opendatasoft.com
- data.smartidf.services
- +1more
csv, excel, geojson +1Updated Jan 16, 2024+ more versionsShareFacebookTwitterEmailClick to copy linkLink copiedCite(2024). Electoral Wards/Divisions - United Kingdom [Dataset]. https://public.opendatasoft.com/explore/dataset/georef-united-kingdom-ward-electoral-division/excel, geojson, json, csvAvailable download formatsDataset updatedJan 16, 2024LicenseOpen Government Licence 3.0http://www.nationalarchives.gov.uk/doc/open-government-licence/version/3/
License information was derived automaticallyArea coveredUnited KingdomDescriptionThis dataset is part of the Geographical repository maintained by Opendatasoft. This dataset contains data for wards/electoral divisions in the United Kingdom.Electoral wards (and electoral divisions) are the key building blocks of UK administrative geography. They are the spatial units used to elect local government councillors in metropolitan and non-metropolitan districts, UAs and the London boroughs in England; UAs in Wales; council areas in Scotland; and local government districts (LGD) in Northern Ireland. Electoral wards are found in Scotland, Wales, Northern Ireland and most of England. In the Isle of Wight and several of the UAs created as part of the Local Government Reorganisation in 2009, the equivalent areas are legally termed 'electoral divisions', although they are frequently referred to as wards. Wales changed to using the term 'electoral wards' instead of 'electoral divisions' in August 2013.The only part of the UK without electoral wards/divisions is the Isles of Scilly, which has its own council but no electoral zoning. For statistical purposes, however, ONS treats the islands' five parishes as electoral wards. Electoral wards/divisions (and the Scilly parishes) cover the whole of the UK; in addition, all higher administrative units are built from whole electoral wards/divisions. They are also used to constitute a range of other geographies such as the Eurostat Nomenclature of Territorial Units for Statistics (NUTS) geographies, health geographies and Westminster parliamentary constituencies. Electoral ward/division boundary changes are usually enacted on the first Thursday in May each year, to coincide with the local government elections.Processors and tools are using this data.EnhancementsAdd ISO 3166-3 codes.Simplify geometries to provide better performance across the services.Add administrative hierarchy.
- G
Political stability by country, around the world | TheGlobalEconomy.com
- theglobaleconomy.com
csv, excel, xmlUpdated Apr 7, 2016+ more versionsShareFacebookTwitterEmailClick to copy linkLink copiedCiteGlobalen LLC (2016). Political stability by country, around the world | TheGlobalEconomy.com [Dataset]. www.theglobaleconomy.com/rankings/wb_political_stability/xml, excel, csvAvailable download formatsDataset updatedApr 7, 2016Dataset authored and provided byGlobalen LLCLicenseAttribution 4.0 (CC BY 4.0)https://creativecommons.org/licenses/by/4.0/
License information was derived automaticallyTime period coveredDec 31, 1996 - Dec 31, 2023Area coveredWorld, WorldDescriptionThe average for 2023 based on 193 countries was -0.07 points. The highest value was in Liechtenstein: 1.61 points and the lowest value was in Syria: -2.75 points. The indicator is available from 1996 to 2023. Below is a chart for all countries where data are available.
Borough Council Election Results 2010
- data.wu.ac.at
csv, html, pdf, xlsUpdated Mar 15, 2018+ more versionsShareFacebookTwitterEmailClick to copy linkLink copiedCiteGreater London Authority (GLA) (2018). Borough Council Election Results 2010 [Dataset]. https://data.wu.ac.at/odso/data_gov_uk/NmIwMmUxZTEtOWJiZS00YTRiLWEwMGUtZmVkZjlmZDhmZDUzxls, csv, pdf, htmlAvailable download formatsDataset updatedMar 15, 2018LicenseAttribution 4.0 (CC BY 4.0)https://creativecommons.org/licenses/by/4.0/
License information was derived automaticallyDescriptionLondon Borough Council Elections - 6 May 2010 With the aim of making the democratic process as transparent as possible to the London electorate, this report includes a great deal of detail on every aspect of the 2010 London Borough council general elections. No other single volume presents the full results and election statistics from the 32 London boroughs enabling the reader to analyse and compare the results across London in one place. The report presents data for every candidate in every ward (excluding the City of London which operates on a different electoral model). Summaries are provided in the form of maps and tables, and to make comparisons easier, they mostly match those included in the 2006 report with a few useful additions. Results of all council by-elections between the general elections in 2006 and 2010, as well as details of the elections in the three boroughs that directly elect a mayor, are also presented here. This is the latest report in a long series of council election reports dating back to 1964. Find other election reports at http://data.london.gov.uk/elections/ REPORT: The report is available in PDF format. Hard copies are available from the Intelligence Unit for £20. Please contact intelligence@london.gov.uk or tel 020 7983 4922 (credit card or cheque accepted). DATA: All the data contained within the 'London Borough Council Elections 2010' report can be accessed in this spreadsheet. This contains results for each candidate standing in all 624 wards in the London boroughs (excluding the City of London which operates on a different electoral model). Also available in the following spreadsheets: ● Full results for every ward and every candidate from 2006 and 2010 ● A summary of the number of seats won by each party by borough including political control. ● Ward and borough turnout data. MOTION CHART: This motion chart shows the relationship, between share of votes and seats won by the major parties in elections since 1964 at borough level (requires Adobe Flash Player). MAP: ) These interactive ward maps help to geographically present election results from 2006 and 2010 and display results for each candidate (requires Adobe Flash Player). Data for the elections in the three boroughs that directly elect a mayor (Newham, Lewisham and Hackney) are not included in the map but are included in the Excel spreadsheet of results.
Discourses of Globalisation and European Integration in the United Kingdom...
- beta.ukdataservice.ac.uk
Updated 2006ShareFacebookTwitterEmailClick to copy linkLink copiedCiteN. Smith (2006). Discourses of Globalisation and European Integration in the United Kingdom and Ireland, 2004-2005 [Dataset]. http://doi.org/10.5255/ukda-sn-5370-1Unique identifierhttps://doi.org/10.5255/ukda-sn-5370-1Dataset updated2006AuthorsN. SmithArea coveredUnited Kingdom, IrelandDescriptionThe principal objective of the research was to survey and map elite political attitudes to globalisation, European integration and the relationship between the two. Explicitly designed as a pilot study for a broader multi-country and multi-language European comparative analysis, the focus of the project was restricted to the United Kingdom (UK) and Ireland, two countries that are particularly well suited to a comparative analysis of this kind due to their common language, their common institutional origins and the structural similarities in their political economies.
The research was informed by the following key questions:- how policy-makers perceive globalisation and European integration (including the relationship between them)
- whether distinctive discourses of globalisation, European integration and the relationship between the two can be identified, how pervasive the concepts are, and to what extent they are conserved between cases and, within cases, between political parties, civil servants and politicians, and front- and back-benchers
- whether such discourses are national in character or are party-political factors the principal determinants of attitudes towards globalisation and European integration
- whether there are disparities between policy-makers' attitudes towards globalisation and European integration, as revealed in survey-based research and the official/public appeal to such discourses
- E
Data from: Scottish Independence Referendum 2014
- dtechtive.com
- find.data.gov.scot
xml, zipUpdated Feb 22, 2017ShareFacebookTwitterEmailClick to copy linkLink copiedCiteUniversity of Edinburgh (2017). Scottish Independence Referendum 2014 [Dataset]. http://doi.org/10.7488/ds/1964xml(0.0041 MB), zip(7.987 MB)Available download formatsUnique identifierhttps://doi.org/10.7488/ds/1964Dataset updatedFeb 22, 2017Dataset provided byUniversity of EdinburghArea coveredScotlandDescriptionthis dataset shows the results of the 2014 referendum on Scottish Independence which took place on the 18th September 2014. The data is broken down into the geographical areas such as Edinburgh, Midlothian, Fife and the Highlands. The data shows the number of Yes/No votes, the percentage and the difference between the two (positive depicts a No win). It is interesting to note that anyone over the age of 16 was eligible to vote, a change to the normal over 18 policy in general elections. Turnout was high with 84.6% of those eligible voting. The data was sourced from: http://www.cityam.com/1411046935/who-won-where-how-scottish-councils-voted-independence-referendum-results-map and then combined with Boundary Data from the OS Opendata that provided the geographical boundaries. Another good source of info and maps is http://www.bbc.co.uk/news/uk-scotland-scotland-politics-29255449. GIS vector data. This dataset was first accessioned in the EDINA ShareGeo Open repository on 2014-09-24 and migrated to Edinburgh DataShare on 2017-02-22.
- e
Discourses of Globalisation and European Integration in the United Kingdom...
- b2find.eudat.eu
Updated Apr 27, 2023ShareFacebookTwitterEmailClick to copy linkLink copiedCite(2023). Discourses of Globalisation and European Integration in the United Kingdom and Ireland, 2004-2005 - Dataset - B2FIND [Dataset]. https://b2find.eudat.eu/dataset/66703033-20c2-50d4-877a-022e47594f06Dataset updatedApr 27, 2023Area coveredIreland, United Kingdom, IrelandDescriptionAbstract copyright UK Data Service and data collection copyright owner. The principal objective of the research was to survey and map elite political attitudes to globalisation, European integration and the relationship between the two. Explicitly designed as a pilot study for a broader multi-country and multi-language European comparative analysis, the focus of the project was restricted to the United Kingdom (UK) and Ireland, two countries that are particularly well suited to a comparative analysis of this kind due to their common language, their common institutional origins and the structural similarities in their political economies. The research was informed by the following key questions: how policy-makers perceive globalisation and European integration (including the relationship between them)whether distinctive discourses of globalisation, European integration and the relationship between the two can be identified, how pervasive the concepts are, and to what extent they are conserved between cases and, within cases, between political parties, civil servants and politicians, and front- and back-bencherswhether such discourses are national in character or are party-political factors the principal determinants of attitudes towards globalisation and European integrationwhether there are disparities between policy-makers' attitudes towards globalisation and European integration, as revealed in survey-based research and the official/public appeal to such discoursesThe research was conducted via a postal questionnaire, which was sent to all Members of Parliament (MPs) in the UK, all Members of the Dail (parliament) in Ireland, and 1,000 UK and Irish civil servants. This consisted of closed questions with identical scalar answer formats that reflected a range of perspectives regarding globalisation and European integration. The postal survey was backed by detailed discourse analysis of policy documents and a small number of semi-structured interviews with senior policy-makers from both countries (only the postal survey responses are included in the dataset). Main Topics: Topics covered in the questionnaire include: attitudes towards globalisation and its political, social, cultural and economic dynamics, the advantages and disadvantages of European integration, and European Monetary Union (EMU). Demographic details were also gathered. It should be noted that the responses of UK civil servants to questions 8, 9, 10 and 27 on the questionnaire have not been included in the dataset.
Present-day countries in the British Empire 1600-2000
- statista.com
Updated Aug 12, 2024ShareFacebookTwitterEmailClick to copy linkLink copiedCiteStatista (2024). Present-day countries in the British Empire 1600-2000 [Dataset]. https://www.statista.com/statistics/1070352/number-current-countries-in-british-empire/Dataset updatedAug 12, 2024Area coveredUnited KingdomDescriptionIn the century between Napoleon's defeat and the outbreak of the First World War (known as the "Pax Britannica"), the British Empire grew to become the largest and most powerful empire in the world. At its peak in the 1910s and 1920s, it encompassed almost one quarter of both the world's population and its land surface, and was known as "the empire on which the sun never sets". The empire's influence could be felt across the globe, as Britain could use its position to affect trade and economies in all areas of the world, including many regions that were not part of the formal empire (for example, Britain was able to affect trading policy in China for over a century, due to its control of Hong Kong and the neighboring colonies of India and Burma). Some historians argue that because of its economic, military, political and cultural influence, nineteenth century Britain was the closest thing to a hegemonic superpower that the world ever had, and possibly ever will have. "Rule Britannia" Due to the technological and logistical restrictions of the past, we will never know the exact borders of the British Empire each year, nor the full extent of its power. However, by using historical sources in conjunction with modern political borders, we can gain new perspectives and insights on just how large and influential the British Empire actually was. If we transpose a map of all former British colonies, dominions, mandates, protectorates and territories, as well as secure territories of the East India Trading Company (EIC) (who acted as the precursor to the British Empire) onto a current map of the world, we can see that Britain had a significant presence in at least 94 present-day countries (approximately 48 percent). This included large territories such as Australia, the Indian subcontinent, most of North America and roughly one third of the African continent, as well as a strategic network of small enclaves (such as Gibraltar and Hong Kong) and islands around the globe that helped Britain to maintain and protect its trade routes. The sun sets... Although the data in this graph does not show the annual population or size of the British Empire, it does give some context to how Britain has impacted and controlled the development of the world over the past four centuries. From 1600 until 1920, Britain's Empire expanded from a small colony in Newfoundland, a failing conquest in Ireland, and early ventures by the EIC in India, to Britain having some level of formal control in almost half of all present-day countries. The English language is an official language in all inhabited continents, its political and bureaucratic systems are used all over the globe, and empirical expansion helped Christianity to become the most practiced major religion worldwide. In the second half of the twentieth century, imperial and colonial empires were eventually replaced by global enterprises. The United States and Soviet Union emerged from the Second World War as the new global superpowers, and the independence movements in longstanding colonies, particularly Britain, France and Portugal, gradually succeeded. The British Empire finally ended in 1997 when it seceded control of Hong Kong to China, after more than 150 years in charge. Today, the United Kingdom consists of four constituent countries, and it is responsible for three crown dependencies and fourteen overseas territories, although the legacy of the British Empire can still be seen, and it's impact will be felt for centuries to come.
- o
Geographical, historical, political, philosophical and mechanical essays....
- llds.ling-phil.ox.ac.uk
Updated Aug 19, 2023ShareFacebookTwitterEmailClick to copy linkLink copiedCiteLewis Evans; Lewis Evans; James Turner; Lewis Evans (2023). Geographical, historical, political, philosophical and mechanical essays. The first, containing an analysis of a general map of the middle British colonies in America; and of the country of the confederate Indians: a description of the face of the country; the boundaries of the confederates; and the maritime and inland navigations of the several rivers and lakes contained therein. / By Lewis Evans. [Dataset]. https://llds.ling-phil.ox.ac.uk/llds/xmlui/handle/20.500.14106/N05835Dataset updatedAug 19, 2023AuthorsLewis Evans; Lewis Evans; James Turner; Lewis EvansLicenseCC0 1.0 Universal Public Domain Dedicationhttps://creativecommons.org/publicdomain/zero/1.0/
License information was derived automaticallyArea coveredConfederate States of America, United StatesDescription(:unav)...........................................
Mapping income deprivation at a local authority level: 2019
- gov.uk
- s3.amazonaws.com
Updated May 24, 2021ShareFacebookTwitterEmailClick to copy linkLink copiedCiteOffice for National Statistics (2021). Mapping income deprivation at a local authority level: 2019 [Dataset]. https://www.gov.uk/government/statistics/mapping-income-deprivation-at-a-local-authority-level-2019Dataset updatedMay 24, 2021AuthorsOffice for National StatisticsDescriptionOfficial statistics are produced impartially and free from political influence.
FacebookTwitterAs of July 2025, the political party that 18 to 24 year-old's in Great Britain would be most likely to vote for was the Labour Party, at 33 percent, with Labour also the most popular party among those aged 25 to 49. Reform UK was the most popular party for the 50 to 64 age group, with 29 percent of voters saying they would vote for them. For the oldest age group, the Reform was also the most popular, with 35 percent of over 65s intending to vote for them. Reform surge in the polls Since winning the last UK general election in July 2024, the ruling Labour Party have steadily become more unpopular among voters. After winning 33.7 percent of the vote in that election, the party was polling at 24 percent in April 2025, only slightly ahead of Reform UK on 23 percent. A right-wing populist party, Reform benefited from the collapse in support for the center-right Conservative Party in the last election, winning several seats at their expense. While the next UK general election is not due to be held until 2029, the government will be keen to address their collapsing approval ratings, in the face of Reform's rising support. Economic headaches for Labour in 2025 Although Labour inherited a growing economy, with falling inflation, and low unemployment from the Conservatives, the overall economic outlook for the UK is still quite gloomy. The country's government debt is around 100 percent of GDP, and without large tax rises and spending cuts, the government hopes to create a stronger, more resilient economy to reduce the deficit. While this is still a possibility, the UK's economic prospects for 2025 were recently slashed, with growth of one percent forecast, down from an earlier prediction of two percent. Although mainly due to external factors such as the threat of increasing tariffs, and general geopolitical instability, the UK's faltering economy will add further problems to the embattled government.