- a
Label Your Map
- hub.arcgis.com
Updated Jan 17, 2019 Share
Share Facebook
 Twitter
 EmailClick to copy linkLink copiedCiteState of Delaware (2019). Label Your Map [Dataset]. https://hub.arcgis.com/documents/0bbe172962b64d10ab17d6a314b80603Dataset updatedJan 17, 2019Dataset authored and provided byState of DelawareDescription
Map labels help to identify features, establish a visual hierarchy of important features, and focus the map user's attention on the purpose of the map.Estimated time: 25 minutesSoftware requirements: ArcGIS Pro
- s
Visualization & Mind Maps Plugin Statistics
- system3.md
Updated Feb 9, 2025ShareFacebookTwitterEmailClick to copy linkLink copiedCiteSystem 3 (2025). Visualization & Mind Maps Plugin Statistics [Dataset]. https://system3.md/observatory/categories/visualization-mindmapsDataset updatedFeb 9, 2025Dataset authored and provided bySystem 3DescriptionDownload statistics and trends for 141 plugins in the Visualization & Mind Maps category
- f
Retinotopic Maps, Spatial Tuning, and Locations of Human Visual Areas in...
- plos.figshare.com
wmvUpdated May 30, 2023ShareFacebookTwitterEmailClick to copy linkLink copiedCiteLinda Henriksson; Juha Karvonen; Niina Salminen-Vaparanta; Henry Railo; Simo Vanni (2023). Retinotopic Maps, Spatial Tuning, and Locations of Human Visual Areas in Surface Coordinates Characterized with Multifocal and Blocked fMRI Designs [Dataset]. http://doi.org/10.1371/journal.pone.0036859wmvAvailable download formatsUnique identifierhttps://doi.org/10.1371/journal.pone.0036859Dataset updatedMay 30, 2023Dataset provided byPLOS ONEAuthorsLinda Henriksson; Juha Karvonen; Niina Salminen-Vaparanta; Henry Railo; Simo VanniLicenseAttribution 4.0 (CC BY 4.0)https://creativecommons.org/licenses/by/4.0/
License information was derived automaticallyDescriptionThe localization of visual areas in the human cortex is typically based on mapping the retinotopic organization with functional magnetic resonance imaging (fMRI). The most common approach is to encode the response phase for a slowly moving visual stimulus and to present the result on an individual's reconstructed cortical surface. The main aims of this study were to develop complementary general linear model (GLM)-based retinotopic mapping methods and to characterize the inter-individual variability of the visual area positions on the cortical surface. We studied 15 subjects with two methods: a 24-region multifocal checkerboard stimulus and a blocked presentation of object stimuli at different visual field locations. The retinotopic maps were based on weighted averaging of the GLM parameter estimates for the stimulus regions. In addition to localizing visual areas, both methods could be used to localize multiple retinotopic regions-of-interest. The two methods yielded consistent retinotopic maps in the visual areas V1, V2, V3, hV4, and V3AB. In the higher-level areas IPS0, VO1, LO1, LO2, TO1, and TO2, retinotopy could only be mapped with the blocked stimulus presentation. The gradual widening of spatial tuning and an increase in the responses to stimuli in the ipsilateral visual field along the hierarchy of visual areas likely reflected the increase in the average receptive field size. Finally, after registration to Freesurfer's surface-based atlas of the human cerebral cortex, we calculated the mean and variability of the visual area positions in the spherical surface-based coordinate system and generated probability maps of the visual areas on the average cortical surface. The inter-individual variability in the area locations decreased when the midpoints were calculated along the spherical cortical surface compared with volumetric coordinates. These results can facilitate both analysis of individual functional anatomy and comparisons of visual cortex topology across studies.
- u
Data repository for paper: Locomotion selectively enhances visual speed...
- rdr.ucl.ac.uk
binUpdated Nov 19, 2025ShareFacebookTwitterEmailClick to copy linkLink copiedCiteEdward Horrocks; Aman Saleem (2025). Data repository for paper: Locomotion selectively enhances visual speed encoding in mouse medial higher visual areas [Dataset]. http://doi.org/10.5522/04/30136174.v1binAvailable download formatsUnique identifierhttps://doi.org/10.5522/04/30136174.v1Dataset updatedNov 19, 2025Dataset provided byUniversity College LondonAuthorsEdward Horrocks; Aman SaleemLicenseAttribution-NonCommercial-ShareAlike 4.0 (CC BY-NC-SA 4.0)https://creativecommons.org/licenses/by-nc-sa/4.0/
License information was derived automaticallyDescriptionData for the paper, "Locomotion selectively enhances visual speed encoding in mouse medial higher visual areas". These data include electrophysiology recordings from different mouse visual areas collected using multiple NeuroPixel high-density electrodes. Data were collected in awake head-restrained mice viewing visual stimuli and able to run over a treadmill. Data uploaded here is processed data from the Allen Institute dataset, and the orginal dataset was published here: Siegle, J. H. et al. Survey of spiking in the mouse visual system reveals functional hierarchy. Nature 592, 86–92 (2021).Allen Institute for Brain Science. The Allen Brain Observatory Visual Coding Neuropixels Dataset. (2019). Available from: https://portal.brain-map.org/explore/circuits/visual-coding-neuropixels
- N
Propagation of Information Along the Cortical Hierarchy as a Function of...
- neurovault.org
niftiUpdated Aug 18, 2020+ more versionsShareFacebookTwitterEmailClick to copy linkLink copiedCite(2020). Propagation of Information Along the Cortical Hierarchy as a Function of Attention While Reading and Listening to Stories: Text processing with attention [Dataset]. http://identifiers.org/neurovault.image:67607niftiAvailable download formatsUnique identifierhttps://identifiers.org/neurovault.image:67607Dataset updatedAug 18, 2020LicenseCC0 1.0 Universal Public Domain Dedicationhttps://creativecommons.org/publicdomain/zero/1.0/
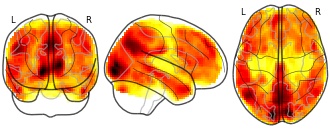
License information was derived automaticallyDescriptionA voxel-based inter-subject correlation (ISC) between the typical responses of a unimodal group of readers with the responses of the multimodal group who attended the written story.
Collection description
How does attention route information from sensory to high-order areas as a function of task, within the relatively fixed topology of the brain? In this study, participants were simultaneously presented with two unrelated stories – one spoken and one written – and asked to attend one while ignoring the other. We used fMRI and a novel inter-subject correlation analysis to track the spread of information along the processing hierarchy as a function of task. Processing the unattended spoken (written) information was confined to auditory (visual) cortices. In contrast, attending to the spoken (written) story enhanced the stimulus-selective responses in sensory regions and allowed it to spread into higher-order areas. Surprisingly, we found that the story-specific spoken (written) responses for the attended story also reached secondary visual (auditory) regions of the unattended sensory modality. These results demonstrate how attention enhances the processing of attended input and allows it to propagate across brain areas.
Subject species
homo sapiens
Modality
fMRI-BOLD
Analysis level
group
Cognitive paradigm (task)
reading (overt)
Map type
Other

Not seeing a result you expected?
Learn how you can add new datasets to our index.
FacebookTwitterMap labels help to identify features, establish a visual hierarchy of important features, and focus the map user's attention on the purpose of the map.Estimated time: 25 minutesSoftware requirements: ArcGIS Pro