- D
Data from: Overlap in externally and internally generated visual...
- data.ru.nl
03_435_v1Updated Jan 15, 2025 Share
Share Facebook
 Twitter
 EmailClick to copy linkLink copiedCiteNadine Dijkstra; Simon van Gaal; Linda Geerligs; Sander Bosch; Marcel van Gerven (2025). Overlap in externally and internally generated visual representations [Dataset]. http://doi.org/10.34973/j9yn-q41903_435_v1(278452714812 bytes)Available download formatsUnique identifierhttps://doi.org/10.34973/j9yn-q419Dataset updatedJan 15, 2025Dataset provided byRadboud UniversityAuthorsNadine Dijkstra; Simon van Gaal; Linda Geerligs; Sander Bosch; Marcel van GervenDescription
This dataset contains fMRI data of the same stimuli during mental imagery (retro-cue task), unconscious and conscious perception (backward masking) with a animacy categorization task and visibility/vividness ratings.
- u
Teaching the visual system to segment and interpret images of overlapping...
- datacatalogue.ukdataservice.ac.uk
- eprints.soton.ac.uk
Updated Feb 21, 2017ShareFacebookTwitterEmailClick to copy linkLink copiedCiteDonnelly, N, University of Southampton; Godwin, H, University of Southampton (2017). Teaching the visual system to segment and interpret images of overlapping transparent objects [Dataset]. http://doi.org/10.5255/UKDA-SN-852290Unique identifierhttps://doi.org/10.5255/UKDA-SN-852290Dataset updatedFeb 21, 2017AuthorsDonnelly, N, University of Southampton; Godwin, H, University of SouthamptonArea coveredUnited KingdomDescriptionBehavioural and eye-movement data gathered from five experiments that examined visual search behaviour/performance in stereoscopic displays. Experiments 1-4 involved examining search of stereoscopic displays under varying levels of overlap (0%, 45%, 90%), and varying task conditions (participants were asked to search for either one or two targets). Each of the first four experiments involved search for a different stimulus type (covering opaque polygons, transparent polygons, household objects and X-ray images respectively). Experiment 5 involved training participants to search through X-ray images for a series of sessions either in the presence of stereoscopic depth, or in flat displays, following by a transfer session to flat displays. Experiments 1-4 involved eye-tracking and Experiment 5 involved eye-tracking every four sessions, as well as in the transfer session.
A considerable amount of research has examined the problems associated with searching for multiple target objects, with a particular focus on X-ray baggage screening, where security personnel must search for a number of different objects simultaneously.
The goal of this project is to extend the previous research that has been conducted by examining the complexities associated with X-ray images, such as transparency and overlap. Security search for threat items (weapons) within X-ray images of baggage presents a challenge for the visual system because X-ray images do not conform to the conventional rules of solidity, interposition and opacity. In X-ray images, transparency causes colour changes at points of overlap. The colours representing each object interact at areas of overlap in a way that is largely unfamiliar to the visual system.
In this project, a series of experiments will be conducted using eye-tracking methodology to understand and explore the complexities involved in searching displays of this type. Furthermore, the displays will be presented in both 2D and 3D, to determine whether any difficulties associated with searching transparent overlapping images can be overcome when the objects are separated into different layers of depth.
- f
Criteria and scores for the visual evaluation.
- datasetcatalog.nlm.nih.gov
- plos.figshare.com
Updated Mar 27, 2015ShareFacebookTwitterEmailClick to copy linkLink copiedCiteTiret, Brice; Lehéricy, Stéphane; Trunet, Stéphanie; Benali, Habib; Chen, Raphaël; Pradat, Pierre-François; Pélégrini-Issac, Mélanie; Mendili, Mohamed-Mounir El; Villard, Noémie (2015). Criteria and scores for the visual evaluation. [Dataset]. https://datasetcatalog.nlm.nih.gov/dataset?q=0001908927Dataset updatedMar 27, 2015AuthorsTiret, Brice; Lehéricy, Stéphane; Trunet, Stéphanie; Benali, Habib; Chen, Raphaël; Pradat, Pierre-François; Pélégrini-Issac, Mélanie; Mendili, Mohamed-Mounir El; Villard, NoémieDescription1Insufficient to moderate overlap in at least 3 vertebral levels.2Insufficient to moderate overlap in less than 3 vertebral levels.3Global substantial overlap agreement.4Global perfect overlap agreement.Criteria and scores for the visual evaluation.
- N
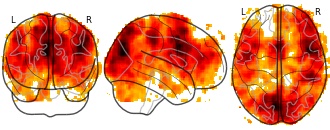
The neural processes underpinning flexible semantic retrieval in visual and...
- neurovault.org
niftiUpdated May 28, 2024ShareFacebookTwitterEmailClick to copy linkLink copiedCite(2024). The neural processes underpinning flexible semantic retrieval in visual and auditory modalities: Overlap between semantic control and multiple demand networks [Dataset]. http://identifiers.org/neurovault.image:869422niftiAvailable download formatsUnique identifierhttps://identifiers.org/neurovault.image:869422Dataset updatedMay 28, 2024LicenseCC0 1.0 Universal Public Domain Dedicationhttps://creativecommons.org/publicdomain/zero/1.0/
License information was derived automaticallyDescription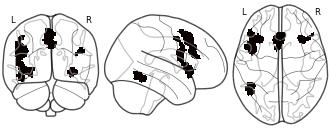
Collection description
Subject species
homo sapiens
Modality
fMRI-BOLD
Analysis level
meta-analysis
Cognitive paradigm (task)
None / Other
Map type
R
- N
Overlapping frontoparietal networks for tactile and visual parametric...
- neurovault.org
niftiUpdated Jun 30, 2018+ more versionsShareFacebookTwitterEmailClick to copy linkLink copiedCite(2018). Overlapping frontoparietal networks for tactile and visual parametric working memory representations: Searchlight multivariate Decoding 2: visual working memory [Dataset]. http://identifiers.org/neurovault.image:55616niftiAvailable download formatsUnique identifierhttps://identifiers.org/neurovault.image:55616Dataset updatedJun 30, 2018LicenseCC0 1.0 Universal Public Domain Dedicationhttps://creativecommons.org/publicdomain/zero/1.0/
License information was derived automaticallyDescriptionDecoding of remembered vibrotactile frequencies during working memory delay (unthresholded)
Collection description
Previous working memory (WM) research based on non-human primate electrophysiology and human EEG has shown that frontal brain regions maintain frequencies of flutter stimulation across different sensory modalities by means of a supramodal parametric WM code. These findings imply that frontal regions encode the memorized frequencies in a sensory-unspecific, quantitative format. Here, we explored which brain regions maintain information about frequencies provided by different sensory modalities at the level of activity pattern across fMRI voxel populations. Moreover, we sought evidence for a supramodal multivariate WM representation. Participants maintained the same set of frequencies of tactile vibration and visual flicker for a 6 s WM delay in a frequency discrimination task. A support vector regression model for multivariate pattern analysis was applied. We observed that sensory cortices were only selective for memoranda of their corresponding modalities, while frontoparietal regions exhibited distinguishable activity patterns to memorized frequencies regardless of sensory modality. A common multivariate code was not evident in our data. Collectively, we show that mnemonic representations for stimulus frequencies are maintained throughout the cortical hierarchy, in line with the suggested transformation of information across different representational formats. Although evidence for a supramodal multivariate code is absent, our findings underpin the generalized role of the frontoparietal cortex for maintaining quantitative information across sensory modalities.
Subject species
homo sapiens
Modality
fMRI-BOLD
Analysis level
group
Cognitive paradigm (task)
delayed match to sample task
Map type
T
- f
White badge overlap with and between pairwise combinations from The...
- rs.figshare.com
xlsxUpdated Jun 1, 2023ShareFacebookTwitterEmailClick to copy linkLink copiedCiteTammy Keren-Rotem; Uri Roll; Amos Bouskila; Eli Geffen (2023). White badge overlap with and between pairwise combinations from The contextual separation of lateral white line patterns in chameleons. [Dataset]. http://doi.org/10.6084/m9.figshare.5802645.v2xlsxAvailable download formatsUnique identifierhttps://doi.org/10.6084/m9.figshare.5802645.v2Dataset updatedJun 1, 2023Dataset provided byThe Royal SocietyAuthorsTammy Keren-Rotem; Uri Roll; Amos Bouskila; Eli GeffenLicenseAttribution 4.0 (CC BY 4.0)https://creativecommons.org/licenses/by/4.0/
License information was derived automaticallyDescriptionThe percentage overlap of the white badge within individual and between all individual pairwise combinations
- f
Data from: Overlap between telangiectasia and photoreceptor loss increases...
- datasetcatalog.nlm.nih.gov
- plos.figshare.com
Updated Oct 28, 2019ShareFacebookTwitterEmailClick to copy linkLink copiedCiteFawzi, Amani A.; Micevych, Paul S.; Lee, Hee Eun (2019). Overlap between telangiectasia and photoreceptor loss increases with progression of macular telangiectasia type 2 [Dataset]. https://datasetcatalog.nlm.nih.gov/dataset?q=0000135520Dataset updatedOct 28, 2019AuthorsFawzi, Amani A.; Micevych, Paul S.; Lee, Hee EunDescriptionObjectivesTo examine the topographical correlation between ellipsoid zone loss and telangiectasia in the deep capillary plexus in patients with macular telangiectasia type 2 (MacTel).Methods38 eyes (20 subjects) diagnosed with MacTel were imaged with OCTA between March 2016 and June 2019 in this single center, cross-sectional observational study. The en face OCTA and OCT were evaluated for areas of deep capillary plexus telangiectasia and ellipsoid zone loss, respectively, and their outlines were superimposed to study their overlap (mm2). The primary outcome was percentage of overlap and its relationship to MacTel stage. Secondary outcomes included the relationship between neovascularization and hyperreflective foci as well as correlations between ellipsoid zone loss, deep capillary plexus telangiectasia and visual acuity.ResultsIn nonproliferative MacTel stage, ellipsoid zone loss was localized to margins of telangiectatic areas (mean overlap = 15.2%). In proliferative stages, ellipsoid zone loss showed a higher degree of overlap with telangiectatic areas (mean overlap = 62.8%). Overlap increased with advancing MacTel stages, with an overall average of 45.3%. Overlap correlated highly with ellipsoid zone loss (r = 0.831; p<0.0001). Telangiectasia was present in all 38 eyes (range: 0.08mm2–0.99mm2), while ellipsoid zone loss was absent in 6 (range: 0.00–3.32mm2). Visual acuity correlated most strongly with ellipsoid zone loss (r = 0.569; p = 0.0002), followed by overlap (r = 0.544; p = 0.0004), and finally, telangiectasia (r = 0.404; p<0.0118). Presence of hyperreflective foci on OCT correlated with the presence and intraretinal location of neovascularization.ConclusionsEllipsoid zone loss occurs at the margins of deep capillary plexus telangiectasia in nonproliferative MacTel, with progressively increasing overlap as MacTel advances, peaking in proliferative disease. Deep capillary plexus telangiectasia and its overlap with ellipsoid zone loss are two promising markers of nonproliferative MacTel, while hyper-reflective foci are markers for proliferative MacTel.
- i
Youth of Utrecht. (2024). Child Gap Overlap Task - Prosaccade [Data set]....
- data.individualdevelopment.nl
Updated Oct 17, 2024+ more versionsShareFacebookTwitterEmailClick to copy linkLink copiedCite(2024). Youth of Utrecht. (2024). Child Gap Overlap Task - Prosaccade [Data set]. Utrecht University. https://doi.org/10.60641/3m3d-1d05 [Dataset]. https://data.individualdevelopment.nl/dataset/91d5eeb0cc2b2de7371402e4c641266bDataset updatedOct 17, 2024DescriptionThe Gap-overlap task is a gaze contingent paradigm that measures visual attention shifting between a central and a peripheral stimulus. This is thought to be a key process underlying behavioral control. The Gap-overlap task contains three conditions; i) Gap, in which the central stimulus disappears 200ms before the appearance of the peripheral target; ii) Baseline, in which the central stimulus disappears simultaneously with the appearance of the peripheral target; iii) Overlap, in which the central stimulus remains on screen during peripheral target presentation. In the prosaccade version of the task, which is followed by the antisaccade version of the task, children are instructed to look at the peripheral stimulus appearing on the screen. During the task, a Tobii TX300 eye-tracker records eye movements at 300 Hz. Key dependent variables are latency to shift attention to the peripheral stimulus in the Gap vs Baseline conditions (Facilitation) and Gap vs Overlap conditions (Disengagement). Data were collected up until May 2022. An infant version of the the Gap Overlap - Prosaccade task was conducted in YOUth Baby and Child at 5 months, 10 months and 3 years old.
Average feature point distribution uniformity across image groups in the...
- plos.figshare.com
binUpdated Oct 23, 2023ShareFacebookTwitterEmailClick to copy linkLink copiedCiteGuoming Chu; Yan Peng; Xuhong Luo (2023). Average feature point distribution uniformity across image groups in the Oxford dataset. [Dataset]. http://doi.org/10.1371/journal.pone.0293111.t002binAvailable download formatsUnique identifierhttps://doi.org/10.1371/journal.pone.0293111.t002Dataset updatedOct 23, 2023AuthorsGuoming Chu; Yan Peng; Xuhong LuoLicenseAttribution 4.0 (CC BY 4.0)https://creativecommons.org/licenses/by/4.0/
License information was derived automaticallyDescriptionAverage feature point distribution uniformity across image groups in the Oxford dataset.
Mean precision for image groups based on the Oxford dataset.
- plos.figshare.com
binUpdated Oct 23, 2023ShareFacebookTwitterEmailClick to copy linkLink copiedCiteGuoming Chu; Yan Peng; Xuhong Luo (2023). Mean precision for image groups based on the Oxford dataset. [Dataset]. http://doi.org/10.1371/journal.pone.0293111.t003binAvailable download formatsUnique identifierhttps://doi.org/10.1371/journal.pone.0293111.t003Dataset updatedOct 23, 2023AuthorsGuoming Chu; Yan Peng; Xuhong LuoLicenseAttribution 4.0 (CC BY 4.0)https://creativecommons.org/licenses/by/4.0/
License information was derived automaticallyDescriptionMean precision for image groups based on the Oxford dataset.
Overlapping between shape-based categories and D-MST neuronal-based...
- plos.figshare.com
xlsUpdated Jun 2, 2023+ more versionsShareFacebookTwitterEmailClick to copy linkLink copiedCiteCarlo Baldassi; Alireza Alemi-Neissi; Marino Pagan; James J. DiCarlo; Riccardo Zecchina; Davide Zoccolan (2023). Overlapping between shape-based categories and D-MST neuronal-based clusters. [Dataset]. http://doi.org/10.1371/journal.pcbi.1003167.t002xlsAvailable download formatsUnique identifierhttps://doi.org/10.1371/journal.pcbi.1003167.t002Dataset updatedJun 2, 2023AuthorsCarlo Baldassi; Alireza Alemi-Neissi; Marino Pagan; James J. DiCarlo; Riccardo Zecchina; Davide ZoccolanLicenseAttribution 4.0 (CC BY 4.0)https://creativecommons.org/licenses/by/4.0/
License information was derived automaticallyDescriptionThe table reports the overlap (fifth column) between each shape-based category (first column) and the D-MST neuronal-based cluster (second column) containing the best matching sub-tree of contiguous objects. Same table structure and symbols as in Table 1.
Data from: Vicarious touch: overlapping neural patterns between seeing and...
- openneuro.org
Updated Jul 6, 2023ShareFacebookTwitterEmailClick to copy linkLink copiedCiteSophie Smit; Denise Moerel; Regine Zopf; Anina N Rich (2023). Vicarious touch: overlapping neural patterns between seeing and feeling touch [Dataset]. http://doi.org/10.18112/openneuro.ds004563.v1.0.1Unique identifierhttps://doi.org/10.18112/openneuro.ds004563.v1.0.1Dataset updatedJul 6, 2023AuthorsSophie Smit; Denise Moerel; Regine Zopf; Anina N RichLicenseCC0 1.0 Universal Public Domain Dedicationhttps://creativecommons.org/publicdomain/zero/1.0/
License information was derived automaticallyDescriptionData collection took place at Macquarie University in Sydney Australia. The study was approved by the Macquarie University Ethics Committee.
We used time-resolved multivariate pattern analysis on whole-brain EEG data from people with and without vicarious touch experiences to test whether seen touch evokes overlapping neural representations with the first-hand experience of touch. Participants felt touch to the fingers (tactile trials) or watched carefully matched videos of touch to another person’s fingers (visual trials).
There were 12 runs in total, divided into four blocks of 36 trials (with alternating sets of nine tactile and nine visual trials) resulting in a total of 1728 trials (864 tactile and 864 visual). There were an additional 240 target trials (20 per run), which were excluded from analysis.
Between trials there was an inter-trial-interval of 800ms. Each run lasted approximately 7-8 minutes with short breaks between blocks and runs.
Whole brain 64-channel EEG data were recorded using an Active Two Biosemi system (Biosemi, Inc.) at 2048Hz and 10-20 standard caps. Stimuli were presented using MATLAB (MathWorks) and Psychtoolbox (Brainard and Vision). The experiment presentation script, all analysis code, and stimuli are made available (see code and stimuli folder). The data is made available both in raw form (see each participant's file) and after processing (see derivatives).
- d
Building variation in visual displays through discrete modifications of...
- search.dataone.org
- datadryad.org
Updated Oct 9, 2025ShareFacebookTwitterEmailClick to copy linkLink copiedCiteKristina Fialko; Trevor Price (2025). Building variation in visual displays through discrete modifications of motion [Dataset]. http://doi.org/10.5061/dryad.1rn8pk177Unique identifierhttps://doi.org/10.5061/dryad.1rn8pk177Dataset updatedOct 9, 2025Dataset provided byDryad Digital RepositoryAuthorsKristina Fialko; Trevor PriceDescriptionInteractions between conspecifics are often composed of one or more discrete behavioural displays. Here we evaluate a behaviour used in aggressive interactions between conspecific males of 10 species of leaf warblers (Phylloscopus). Using high-speed videography and methods derived from geometric morphometrics, we find that the form of a primary visual display differs significantly among species, but with large intraspecific variation and much overlap in shape space. Additional interspecific differences include a species which does not move its wings at all, two quantitatively different displays in the behavioural repertoire, and the loss or gain of a pale patch on the wing. We conclude that display evolution proceeds largely by adding or subtracting discrete components from an established repertoire, accompanied by slight modifications of the core display. In these ways, more complex displays evolve on the background of the ancestral signal, thereby enabling modifications to appea..., We induced aggressive displays using song playback, filmed the displays using high-speed video, and adapted methods from geometric morphometrics to ask the extent to which the form of the display is conserved or varies across species. Using these videos, we also collected information on wing flick rate. The data was processed using QuickTime player to measure rates, and all further analyses conducted in R. We also measured habitat illuminance in the primary breeding habitats across the elevational gradient using Onset light and temperature loggers. Data from the loggers were downloaded to the HOBOconnect app via Bluetooth at the time of collection and analysed using scripts written for R. , # Data from: Building variation in visual displays through discrete modifications of motion
Dataset DOI: 10.5061/dryad.1rn8pk177
Description of the data and file structure
Files and variables
For each figure and corresponding analyses there is a folder (zip file) that includes the code and related files. All compressed archives will expand to the folder structure containing: code, data, figures and output.Â
- Code is where the R or R markdown scripts are located. In Fig1_Phylogeny and Fig3_Rates the R Markdown scripts are located in the main folder.Â
- Data contains csv files or txt files necessary to run the analyses.Â
- Figures is where the final figures are saved to.
- Outputs contain several subfolders labeled by file extension. For example, graphs or other figures generated by the code can be saved in the tifs or jpegs folders, while the results of an analysis would be saved in the csv folder.
Note that several of these a...,
Data from: Task-related concurrent but opposite modulations of overlapping...
- openneuro.org
Updated Jul 14, 2018+ more versionsShareFacebookTwitterEmailClick to copy linkLink copiedCiteJ Xu; S Zhang; VD Calhoun; J Monterosso; MN Potenza (2018). Task-related concurrent but opposite modulations of overlapping functional networks as revealed by spatial ICA [Dataset]. https://openneuro.org/datasets/ds000122Dataset updatedJul 14, 2018AuthorsJ Xu; S Zhang; VD Calhoun; J Monterosso; MN PotenzaLicenseCC0 1.0 Universal Public Domain Dedicationhttps://creativecommons.org/publicdomain/zero/1.0/
License information was derived automaticallyDescriptionThis dataset was obtained from the OpenfMRI project (http://www.openfmri.org). Accession #: ds000122 Description: Visual Attention Task (block design)
Please cite the following references if you use these data:
J Xu, S Zhang, VD Calhoun, J Monterosso, MN Potenza 2013 Task-related concurrent but opposite modulations of overlapping functional networks as revealed by spatial ICA. NeuroImage 79:62-71 (PMCID: PMC3677796)
04/08/2016: initial release
This dataset is made available under the Public Domain Dedication and License v1.0, whose full text can be found at http://www.opendatacommons.org/licenses/pddl/1.0/. We hope that all users will follow the ODC Attribution/Share-Alike Community Norms (http://www.opendatacommons.org/norms/odc-by-sa/); in particular, while not legally required, we hope that all users of the data will acknowledge the OpenfMRI project and NSF Grant OCI-1131441 (R. Poldrack, PI) in any publications.
Events Headings: -ReactionTime: Reaction Time -ResponseButtonCode: Response Button Code (33 is hit, 0 is no response, others were wrong response) -OnsetBlock: Starting time of each block -OnsetTrial: Starting time of each trial -TaskLevel: Task level -TargetNontarget: 1=target; 0=nontarget
- n
Sympatry drives colour and song divergence in wood-warblers (Parulidae)
- data.niaid.nih.gov
- datadryad.org
zipUpdated Dec 11, 2020ShareFacebookTwitterEmailClick to copy linkLink copiedCiteRichard Simpson; David Wilson; Allison F. Mistakidis; Daniel Mennill; Stéphanie M. Doucet (2020). Sympatry drives colour and song divergence in wood-warblers (Parulidae) [Dataset]. http://doi.org/10.5061/dryad.m63xsj410zipAvailable download formatsUnique identifierhttps://doi.org/10.5061/dryad.m63xsj410Dataset updatedDec 11, 2020Dataset provided byUniversity of Windsor
Memorial University of NewfoundlandAuthorsRichard Simpson; David Wilson; Allison F. Mistakidis; Daniel Mennill; Stéphanie M. DoucetLicensehttps://spdx.org/licenses/CC0-1.0.htmlhttps://spdx.org/licenses/CC0-1.0.html
DescriptionClosely related species often exhibit similarities in appearance and behaviour, yet when related species exist in sympatry, signals may diverge to enhance species recognition. Prior comparative studies provided mixed support for this hypothesis, but the relationship between sympatry and signal divergence is likely non-linear. Constraints on signal diversity may limit signal divergence, especially when large numbers of species are sympatric. We tested the effect of sympatric overlap on plumage colour and song divergence in wood-warblers (Parulidae), a speciose group with diverse visual and vocal signals. We also tested how number of sympatric species influences signal divergence. Allopatric species pairs had overall greater plumage and song divergence compared to sympatric species pairs. However, among sympatric species pairs, plumage divergence positively related to degree of sympatric overlap in males and females, while male song bandwidth and syllable rate divergence negatively related to sympatric overlap. In addition, as the number of species in sympatry increased, average signal divergence among sympatric species decreased, which likely due to constraints on warbler perceptual space and signal diversity. Our findings reveal that sympatry influences signal evolution in warblers, though not always as predicted, and that number of sympatric species can limit sympatry’s influence on signal evolution.
Shows the mean operation time of each algorithm on Oxford dataset in units...
- plos.figshare.com
binUpdated Oct 23, 2023ShareFacebookTwitterEmailClick to copy linkLink copiedCiteGuoming Chu; Yan Peng; Xuhong Luo (2023). Shows the mean operation time of each algorithm on Oxford dataset in units of seconds. [Dataset]. http://doi.org/10.1371/journal.pone.0293111.t005binAvailable download formatsUnique identifierhttps://doi.org/10.1371/journal.pone.0293111.t005Dataset updatedOct 23, 2023AuthorsGuoming Chu; Yan Peng; Xuhong LuoLicenseAttribution 4.0 (CC BY 4.0)https://creativecommons.org/licenses/by/4.0/
License information was derived automaticallyDescriptionShows the mean operation time of each algorithm on Oxford dataset in units of seconds.
Feature points are extracted from images with various scenes and lighting...
- plos.figshare.com
binUpdated Oct 23, 2023ShareFacebookTwitterEmailClick to copy linkLink copiedCiteGuoming Chu; Yan Peng; Xuhong Luo (2023). Feature points are extracted from images with various scenes and lighting conditions. [Dataset]. http://doi.org/10.1371/journal.pone.0293111.t004binAvailable download formatsUnique identifierhttps://doi.org/10.1371/journal.pone.0293111.t004Dataset updatedOct 23, 2023AuthorsGuoming Chu; Yan Peng; Xuhong LuoLicenseAttribution 4.0 (CC BY 4.0)https://creativecommons.org/licenses/by/4.0/
License information was derived automaticallyDescriptionThe mean RMSE of each group is shown in units of pixels.
- m
Multi_layer graph plant leaf segmentation
- data.mendeley.com
Updated Mar 15, 2024+ more versionsShareFacebookTwitterEmailClick to copy linkLink copiedCiteLyasmine ADADA (2024). Multi_layer graph plant leaf segmentation [Dataset]. http://doi.org/10.17632/46n94cngkx.1Unique identifierhttps://doi.org/10.17632/46n94cngkx.1Dataset updatedMar 15, 2024AuthorsLyasmine ADADALicenseAttribution 4.0 (CC BY 4.0)https://creativecommons.org/licenses/by/4.0/
License information was derived automaticallyDescriptionWe showcase the results of our graph-based diffusion technique utilizing random walks with restarts on a multi-layered graph using the publicly accessible Pl@ntleaves (H. Go¨eau, P. Bonnet, A. Joly, N. Boujemaa, D. Barth´el´emy, J.-F. Molino, P. Birnbaum, E. Mouysset, M. Picard, The clef 2011 plant images classification task, Vol. 1177, 2011.) dataset. This dataset comprises 233 high-resolution leaf images taken in their natural environments, presenting various segmentation challenges such as shadows, diverse lighting conditions, and leaf overlap. Our method primarily focuses on identifying leaf regions by initially locating the leaves within the images and then propagating intensity scores from foreground templates to image boundaries to generate saliency maps. By applying a threshold to these saliency maps produced through the diffusion process, we derive binary masks that effectively separate the leaves from the backgrounds. Ground truth images are provided for visual evaluation of our algorithm's performance.Folders description: image: RGB images mask: Ground truth masks FG_templates: foreground templates and bounding boxes defined on dataset images
Salinecy_map: saliency maps obtained by our approach PR_masks: Predicted masks obtained by tresholding our salinecy maps Plant_Leaf_Segmentation: a compressed folder containing the above folders. Details of each algorithm.
- plos.figshare.com
binUpdated Oct 23, 2023ShareFacebookTwitterEmailClick to copy linkLink copiedCiteGuoming Chu; Yan Peng; Xuhong Luo (2023). Details of each algorithm. [Dataset]. http://doi.org/10.1371/journal.pone.0293111.t001binAvailable download formatsUnique identifierhttps://doi.org/10.1371/journal.pone.0293111.t001Dataset updatedOct 23, 2023AuthorsGuoming Chu; Yan Peng; Xuhong LuoLicenseAttribution 4.0 (CC BY 4.0)https://creativecommons.org/licenses/by/4.0/
License information was derived automaticallyDescriptionSimultaneous Localization and Mapping (SLAM) technology is crucial for achieving spatial localization and autonomous navigation. Finding image features that are representative presents a key challenge in visual SLAM systems. The widely used ORB (Oriented FAST and Rotating BRIEF) algorithm achieves rapid image feature extraction. However, traditional ORB algorithms face issues such as dense, overlapping feature points, and imbalanced distribution, resulting in mismatches and redundancies. This paper introduces an image feature extraction algorithm called Adaptive Threshold and Local Gray Difference-ORB(ALGD-ORB) to address these limitations. Specifically, an adaptive threshold is employed to enhance feature point detection, and an improved quadtree method is used to homogenize feature point distribution. This method combines feature descriptors generated from both gray size and gray difference to enhance feature descriptor distinctiveness. By fusing these descriptors, their effectiveness is improved. Experimental results demonstrate that the ALGD-ORB algorithm significantly enhances the uniformity of feature point distribution compared to other algorithms, while maintaining accuracy and real-time performance.
Spatial and dietary overlap between red snapper and vermilion snapper (NCEI...
- search.dataone.org
- datasets.ai
- +1more
Updated Mar 24, 2016+ more versionsShareFacebookTwitterEmailClick to copy linkLink copiedCiteNOAA NCEI Environmental Data Archive (2016). Spatial and dietary overlap between red snapper and vermilion snapper (NCEI Accession 0130920) [Dataset]. https://search.dataone.org/view/%7BCA6D3B79-7DBB-48BD-97A1-18599904B66C%7DDataset updatedMar 24, 2016Dataset provided byNational Oceanic and Atmospheric Administrationhttp://www.noaa.gov/
National Centers for Environmental Informationhttps://www.ncei.noaa.gov/Time period coveredApr 1, 2011 - Apr 30, 2012Area coveredDescriptionThis dataset contains abundance data for nine species of reef fish observed at 40 reef sites between Mobile Bay, Alabama and Saint Andrews Bay, Florida, during research cruises in April 2011, August 2011, and April 2012. It also contains gut content analysis data for two of these species - red snapper (Lutjanus campechanus) and vermilion snapper (Rhomboplites aurorubens) - sampled from half of the sites during each cruise.
FacebookTwitterData from: Overlap in externally and internally generated visual representations
This dataset contains fMRI data of the same stimuli during mental imagery (retro-cue task), unconscious and conscious perception (backward masking) with a animacy categorization task and visibility/vividness ratings.