The big dataset of ultra-marathon running
- kaggle.com
Updated Jul 12, 2023 Share
Share Facebook
 Twitter
 EmailClick to copy linkLink copiedCiteDavid (2023). The big dataset of ultra-marathon running [Dataset]. https://www.kaggle.com/datasets/aiaiaidavid/the-big-dataset-of-ultra-marathon-runningCroissantCroissant is a format for machine-learning datasets. Learn more about this at mlcommons.org/croissant.Dataset updatedJul 12, 2023AuthorsDavidLicense
https://creativecommons.org/publicdomain/zero/1.0/https://creativecommons.org/publicdomain/zero/1.0/
DescriptionAccording to the Wikipedia, an ultramarathon, also called ultra distance or ultra running, is any footrace longer than the traditional marathon length of 42.195 kilometres (26 mi 385 yd). Various distances are raced competitively, from the shortest common ultramarathon of 31 miles (50 km) to over 200 miles (320 km). 50k and 100k are both World Athletics record distances, but some 100 miles (160 km) races are among the oldest and most prestigious events, especially in North America.}
The data in this file is a large collection of ultra-marathon race records registered between 1798 and 2022 (a period of well over two centuries) being therefore a formidable long term sample. All data was obtained from public websites.
Despite the original data being of public domain, the race records, which originally contained the athlete´s names, have been anonymized to comply with data protection laws and to preserve the athlete´s privacy. However, a column Athlete ID has been created with a numerical ID representing each unique runner (so if Antonio Fernández participated in 5 races over different years, then the corresponding race records now hold his unique Athlete ID instead of his name). This way I have preserved valuable information.
The dataset contains 7,461,226 ultra-marathon race records from 1,641,168 unique athletes.
The following columns (with data types) are included:
- Year of event (int64)
- Event dates (object)
- Event name (object)
- Event distance/length (object)
- Event number of finishers (int64)
- Athlete performance (object)
- Athlete club (object)
- Athlete country (object)
- Athlete year of birth (float64)
- Athlete gender (object)
- Athlete age category (object)
- Athlete average speed (object)
- Athlete ID (int64)
The Event name column include country location information that can be derived to a new column, and similarly seasonal information can be found in the Event dates column beyond the Year of event (these can be extracted with a bit of processing).
The Event distance/length column describes the type of race, covering the most popular UM race distances and lengths, and some other specific modalities (multi-day, etc.):
- Distances: 50km, 100km, 50mi, 100mi
- Lengths: 6h, 12h, 24h, 48h, 72h, 6d, 10d
Additionally, there is information of age, gender and speed (in km/h) in other columns.
- N
Comprehensive Income by Age Group Dataset: Longitudinal Analysis of Long...
- neilsberg.com
Updated Aug 7, 2024+ more versionsShareFacebookTwitterEmailClick to copy linkLink copiedCiteNeilsberg Research (2024). Comprehensive Income by Age Group Dataset: Longitudinal Analysis of Long Branch, NJ Household Incomes Across 4 Age Groups and 16 Income Brackets. Annual Editions Collection // 2024 Edition [Dataset]. https://www.neilsberg.com/research/datasets/2edd795b-aeee-11ee-aaca-3860777c1fe6/Dataset updatedAug 7, 2024Dataset authored and provided byNeilsberg ResearchLicenseAttribution 4.0 (CC BY 4.0)https://creativecommons.org/licenses/by/4.0/
License information was derived automaticallyArea coveredLong Branch, New JerseyDataset funded byNeilsberg ResearchDescriptionAbout this dataset
Context
The dataset tabulates the Long Branch household income by age. The dataset can be utilized to understand the age-based income distribution of Long Branch income.
Content
The dataset will have the following datasets when applicable
Please note: The 2020 1-Year ACS estimates data was not reported by the Census Bureau due to the impact on survey collection and analysis caused by COVID-19. Consequently, median household income data for 2020 is unavailable for large cities (population 65,000 and above).
- Long Branch, NJ annual median income by age groups dataset (in 2022 inflation-adjusted dollars)
- Age-wise distribution of Long Branch, NJ household incomes: Comparative analysis across 16 income brackets
Good to know
Margin of Error
Data in the dataset are based on the estimates and are subject to sampling variability and thus a margin of error. Neilsberg Research recommends using caution when presening these estimates in your research.
Custom data
If you do need custom data for any of your research project, report or presentation, you can contact our research staff at research@neilsberg.com for a feasibility of a custom tabulation on a fee-for-service basis.
Inspiration
Neilsberg Research Team curates, analyze and publishes demographics and economic data from a variety of public and proprietary sources, each of which often includes multiple surveys and programs. The large majority of Neilsberg Research aggregated datasets and insights is made available for free download at https://www.neilsberg.com/research/.
Interested in deeper insights and visual analysis?
Explore our comprehensive data analysis and visual representations for a deeper understanding of Long Branch income distribution by age. You can refer the same here
- N
Individual Brain Charting dataset extension, second release of...
- neurovault.org
niftiUpdated Feb 14, 2020+ more versionsShareFacebookTwitterEmailClick to copy linkLink copiedCite(2020). Individual Brain Charting dataset extension, second release of high-resolution fMRI data for cognitive mapping: sub-04_ses-12_task-mtt_sn_dir-pa_run-01_sn_northside_event [Dataset]. http://identifiers.org/neurovault.image:364810niftiAvailable download formatsUnique identifierhttps://identifiers.org/neurovault.image:364810Dataset updatedFeb 14, 2020LicenseCC0 1.0 Universal Public Domain Dedicationhttps://creativecommons.org/publicdomain/zero/1.0/
License information was derived automaticallyDescription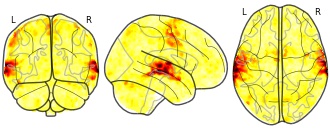
Collection description
The individual Brain Charting (IBC) Project is using high resolution fMRI to map 13 subjects that undergo a large number of tasks: the HCP tasks, the so-called ARCHI tasks, a specific language task, video watching, low-level visual stimulation etc. The native resolution of the data is 1.5mm isotropic. Their main value lies in the large number of contrasts probed, the level of detail and the high SNR per subject. This dataset is meant to provide the basis of a functional brain atlas. We upload here smoothed individual SPMs. The uploaded maps comprise session-specific and fixed effects across maps acquired with AP and PA phase encoding directions.
Note that Neurovault collection #4438 is a subset of that one. In the present collections, some details have been fixed, including mroe accurate and unique file naming.
Subject species
homo sapiens
Modality
fMRI-BOLD
Analysis level
single-subject
Cognitive paradigm (task)
Mental time travel task
Map type
Z
- d
Altosight | AI Custom Web Scraping Data | 100% Global | Free Unlimited Data...
- datarade.ai
.json, .csv, .xlsUpdated Sep 7, 2024ShareFacebookTwitterEmailClick to copy linkLink copiedCiteAltosight (2024). Altosight | AI Custom Web Scraping Data | 100% Global | Free Unlimited Data Points | Bypassing All CAPTCHAs & Blocking Mechanisms | GDPR Compliant [Dataset]. https://datarade.ai/data-products/altosight-ai-custom-web-scraping-data-100-global-free-altosight.json, .csv, .xlsAvailable download formatsDataset updatedSep 7, 2024Dataset authored and provided byAltosightArea coveredWallis and Futuna, Svalbard and Jan Mayen, Chile, Tajikistan, Paraguay, Singapore, Côte d'Ivoire, Greenland, Czech Republic, GuatemalaDescriptionAltosight | AI Custom Web Scraping Data
✦ Altosight provides global web scraping data services with AI-powered technology that bypasses CAPTCHAs, blocking mechanisms, and handles dynamic content.
We extract data from marketplaces like Amazon, aggregators, e-commerce, and real estate websites, ensuring comprehensive and accurate results.
✦ Our solution offers free unlimited data points across any project, with no additional setup costs.
We deliver data through flexible methods such as API, CSV, JSON, and FTP, all at no extra charge.
― Key Use Cases ―
➤ Price Monitoring & Repricing Solutions
🔹 Automatic repricing, AI-driven repricing, and custom repricing rules 🔹 Receive price suggestions via API or CSV to stay competitive 🔹 Track competitors in real-time or at scheduled intervals
➤ E-commerce Optimization
🔹 Extract product prices, reviews, ratings, images, and trends 🔹 Identify trending products and enhance your e-commerce strategy 🔹 Build dropshipping tools or marketplace optimization platforms with our data
➤ Product Assortment Analysis
🔹 Extract the entire product catalog from competitor websites 🔹 Analyze product assortment to refine your own offerings and identify gaps 🔹 Understand competitor strategies and optimize your product lineup
➤ Marketplaces & Aggregators
🔹 Crawl entire product categories and track best-sellers 🔹 Monitor position changes across categories 🔹 Identify which eRetailers sell specific brands and which SKUs for better market analysis
➤ Business Website Data
🔹 Extract detailed company profiles, including financial statements, key personnel, industry reports, and market trends, enabling in-depth competitor and market analysis
🔹 Collect customer reviews and ratings from business websites to analyze brand sentiment and product performance, helping businesses refine their strategies
➤ Domain Name Data
🔹 Access comprehensive data, including domain registration details, ownership information, expiration dates, and contact information. Ideal for market research, brand monitoring, lead generation, and cybersecurity efforts
➤ Real Estate Data
🔹 Access property listings, prices, and availability 🔹 Analyze trends and opportunities for investment or sales strategies
― Data Collection & Quality ―
► Publicly Sourced Data: Altosight collects web scraping data from publicly available websites, online platforms, and industry-specific aggregators
► AI-Powered Scraping: Our technology handles dynamic content, JavaScript-heavy sites, and pagination, ensuring complete data extraction
► High Data Quality: We clean and structure unstructured data, ensuring it is reliable, accurate, and delivered in formats such as API, CSV, JSON, and more
► Industry Coverage: We serve industries including e-commerce, real estate, travel, finance, and more. Our solution supports use cases like market research, competitive analysis, and business intelligence
► Bulk Data Extraction: We support large-scale data extraction from multiple websites, allowing you to gather millions of data points across industries in a single project
► Scalable Infrastructure: Our platform is built to scale with your needs, allowing seamless extraction for projects of any size, from small pilot projects to ongoing, large-scale data extraction
― Why Choose Altosight? ―
✔ Unlimited Data Points: Altosight offers unlimited free attributes, meaning you can extract as many data points from a page as you need without extra charges
✔ Proprietary Anti-Blocking Technology: Altosight utilizes proprietary techniques to bypass blocking mechanisms, including CAPTCHAs, Cloudflare, and other obstacles. This ensures uninterrupted access to data, no matter how complex the target websites are
✔ Flexible Across Industries: Our crawlers easily adapt across industries, including e-commerce, real estate, finance, and more. We offer customized data solutions tailored to specific needs
✔ GDPR & CCPA Compliance: Your data is handled securely and ethically, ensuring compliance with GDPR, CCPA and other regulations
✔ No Setup or Infrastructure Costs: Start scraping without worrying about additional costs. We provide a hassle-free experience with fast project deployment
✔ Free Data Delivery Methods: Receive your data via API, CSV, JSON, or FTP at no extra charge. We ensure seamless integration with your systems
✔ Fast Support: Our team is always available via phone and email, resolving over 90% of support tickets within the same day
― Custom Projects & Real-Time Data ―
✦ Tailored Solutions: Every business has unique needs, which is why Altosight offers custom data projects. Contact us for a feasibility analysis, and we’ll design a solution that fits your goals
✦ Real-Time Data: Whether you need real-time data delivery or scheduled updates, we provide the flexibility to receive data when you need it. Track price changes, monitor product trends, or gather...
- N
Individual Brain Charting dataset extension, second release of...
- neurovault.org
niftiUpdated Feb 15, 2020+ more versionsShareFacebookTwitterEmailClick to copy linkLink copiedCite(2020). Individual Brain Charting dataset extension, second release of high-resolution fMRI data for cognitive mapping: sub-06_ses-02_task-hcp_wm_ffx_2back_face [Dataset]. http://identifiers.org/neurovault.image:368774niftiAvailable download formatsUnique identifierhttps://identifiers.org/neurovault.image:368774Dataset updatedFeb 15, 2020LicenseCC0 1.0 Universal Public Domain Dedicationhttps://creativecommons.org/publicdomain/zero/1.0/
License information was derived automaticallyDescription
Collection description
The individual Brain Charting (IBC) Project is using high resolution fMRI to map 13 subjects that undergo a large number of tasks: the HCP tasks, the so-called ARCHI tasks, a specific language task, video watching, low-level visual stimulation etc. The native resolution of the data is 1.5mm isotropic. Their main value lies in the large number of contrasts probed, the level of detail and the high SNR per subject. This dataset is meant to provide the basis of a functional brain atlas. We upload here smoothed individual SPMs. The uploaded maps comprise session-specific and fixed effects across maps acquired with AP and PA phase encoding directions.
Note that Neurovault collection #4438 is a subset of that one. In the present collections, some details have been fixed, including mroe accurate and unique file naming.
Subject species
homo sapiens
Modality
fMRI-BOLD
Analysis level
single-subject
Cognitive paradigm (task)
working memory fMRI task paradigm
Map type
Z
- N
Comprehensive Income by Age Group Dataset: Longitudinal Analysis of Long...
- neilsberg.com
Updated Aug 7, 2024+ more versionsShareFacebookTwitterEmailClick to copy linkLink copiedCiteNeilsberg Research (2024). Comprehensive Income by Age Group Dataset: Longitudinal Analysis of Long Lake Township, Michigan Household Incomes Across 4 Age Groups and 16 Income Brackets. Annual Editions Collection // 2024 Edition [Dataset]. https://www.neilsberg.com/research/datasets/2edd8095-aeee-11ee-aaca-3860777c1fe6/Dataset updatedAug 7, 2024Dataset authored and provided byNeilsberg ResearchLicenseAttribution 4.0 (CC BY 4.0)https://creativecommons.org/licenses/by/4.0/
License information was derived automaticallyArea coveredLong Lake Township, MichiganDataset funded byNeilsberg ResearchDescriptionAbout this dataset
Context
The dataset tabulates the Long Lake township household income by age. The dataset can be utilized to understand the age-based income distribution of Long Lake township income.
Content
The dataset will have the following datasets when applicable
Please note: The 2020 1-Year ACS estimates data was not reported by the Census Bureau due to the impact on survey collection and analysis caused by COVID-19. Consequently, median household income data for 2020 is unavailable for large cities (population 65,000 and above).
- Long Lake Township, Michigan annual median income by age groups dataset (in 2022 inflation-adjusted dollars)
- Age-wise distribution of Long Lake Township, Michigan household incomes: Comparative analysis across 16 income brackets
Good to know
Margin of Error
Data in the dataset are based on the estimates and are subject to sampling variability and thus a margin of error. Neilsberg Research recommends using caution when presening these estimates in your research.
Custom data
If you do need custom data for any of your research project, report or presentation, you can contact our research staff at research@neilsberg.com for a feasibility of a custom tabulation on a fee-for-service basis.
Inspiration
Neilsberg Research Team curates, analyze and publishes demographics and economic data from a variety of public and proprietary sources, each of which often includes multiple surveys and programs. The large majority of Neilsberg Research aggregated datasets and insights is made available for free download at https://www.neilsberg.com/research/.
Interested in deeper insights and visual analysis?
Explore our comprehensive data analysis and visual representations for a deeper understanding of Long Lake township income distribution by age. You can refer the same here
- N
Individual Brain Charting dataset extension, second release of...
- neurovault.org
niftiUpdated Feb 14, 2020ShareFacebookTwitterEmailClick to copy linkLink copiedCite(2020). Individual Brain Charting dataset extension, second release of high-resolution fMRI data for cognitive mapping: sub-12_ses-22_task-self_dir-ap_run-03_encode_self [Dataset]. http://identifiers.org/neurovault.image:363181niftiAvailable download formatsUnique identifierhttps://identifiers.org/neurovault.image:363181Dataset updatedFeb 14, 2020LicenseCC0 1.0 Universal Public Domain Dedicationhttps://creativecommons.org/publicdomain/zero/1.0/
License information was derived automaticallyDescription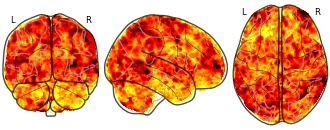
Collection description
The individual Brain Charting (IBC) Project is using high resolution fMRI to map 13 subjects that undergo a large number of tasks: the HCP tasks, the so-called ARCHI tasks, a specific language task, video watching, low-level visual stimulation etc. The native resolution of the data is 1.5mm isotropic. Their main value lies in the large number of contrasts probed, the level of detail and the high SNR per subject. This dataset is meant to provide the basis of a functional brain atlas. We upload here smoothed individual SPMs. The uploaded maps comprise session-specific and fixed effects across maps acquired with AP and PA phase encoding directions.
Note that Neurovault collection #4438 is a subset of that one. In the present collections, some details have been fixed, including mroe accurate and unique file naming.
Subject species
homo sapiens
Modality
fMRI-BOLD
Analysis level
single-subject
Cognitive paradigm (task)
Self evaluation task
Map type
Z
- N
Comprehensive Income by Age Group Dataset: Longitudinal Analysis of Big...
- neilsberg.com
Updated Aug 7, 2024+ more versionsShareFacebookTwitterEmailClick to copy linkLink copiedCiteNeilsberg Research (2024). Comprehensive Income by Age Group Dataset: Longitudinal Analysis of Big Rapids charter Township, Michigan Household Incomes Across 4 Age Groups and 16 Income Brackets. Annual Editions Collection // 2024 Edition [Dataset]. https://www.neilsberg.com/research/datasets/2ebda086-aeee-11ee-aaca-3860777c1fe6/Dataset updatedAug 7, 2024Dataset authored and provided byNeilsberg ResearchLicenseAttribution 4.0 (CC BY 4.0)https://creativecommons.org/licenses/by/4.0/
License information was derived automaticallyArea coveredBig Rapids Township, MichiganDataset funded byNeilsberg ResearchDescriptionAbout this dataset
Context
The dataset tabulates the Big Rapids charter township household income by age. The dataset can be utilized to understand the age-based income distribution of Big Rapids charter township income.
Content
The dataset will have the following datasets when applicable
Please note: The 2020 1-Year ACS estimates data was not reported by the Census Bureau due to the impact on survey collection and analysis caused by COVID-19. Consequently, median household income data for 2020 is unavailable for large cities (population 65,000 and above).
- Big Rapids charter Township, Michigan annual median income by age groups dataset (in 2022 inflation-adjusted dollars)
- Age-wise distribution of Big Rapids charter Township, Michigan household incomes: Comparative analysis across 16 income brackets
Good to know
Margin of Error
Data in the dataset are based on the estimates and are subject to sampling variability and thus a margin of error. Neilsberg Research recommends using caution when presening these estimates in your research.
Custom data
If you do need custom data for any of your research project, report or presentation, you can contact our research staff at research@neilsberg.com for a feasibility of a custom tabulation on a fee-for-service basis.
Inspiration
Neilsberg Research Team curates, analyze and publishes demographics and economic data from a variety of public and proprietary sources, each of which often includes multiple surveys and programs. The large majority of Neilsberg Research aggregated datasets and insights is made available for free download at https://www.neilsberg.com/research/.
Interested in deeper insights and visual analysis?
Explore our comprehensive data analysis and visual representations for a deeper understanding of Big Rapids charter township income distribution by age. You can refer the same here
- N
Individual Brain Charting dataset extension, second release of...
- neurovault.org
niftiUpdated Feb 14, 2020ShareFacebookTwitterEmailClick to copy linkLink copiedCite(2020). Individual Brain Charting dataset extension, second release of high-resolution fMRI data for cognitive mapping: sub-04_ses-21_task-self_dir-pa_run-02_recognition_other_hit [Dataset]. http://identifiers.org/neurovault.image:364869niftiAvailable download formatsUnique identifierhttps://identifiers.org/neurovault.image:364869Dataset updatedFeb 14, 2020LicenseCC0 1.0 Universal Public Domain Dedicationhttps://creativecommons.org/publicdomain/zero/1.0/
License information was derived automaticallyDescription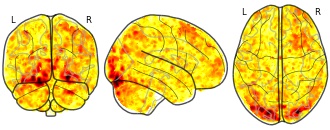
Collection description
The individual Brain Charting (IBC) Project is using high resolution fMRI to map 13 subjects that undergo a large number of tasks: the HCP tasks, the so-called ARCHI tasks, a specific language task, video watching, low-level visual stimulation etc. The native resolution of the data is 1.5mm isotropic. Their main value lies in the large number of contrasts probed, the level of detail and the high SNR per subject. This dataset is meant to provide the basis of a functional brain atlas. We upload here smoothed individual SPMs. The uploaded maps comprise session-specific and fixed effects across maps acquired with AP and PA phase encoding directions.
Note that Neurovault collection #4438 is a subset of that one. In the present collections, some details have been fixed, including mroe accurate and unique file naming.
Subject species
homo sapiens
Modality
fMRI-BOLD
Analysis level
single-subject
Cognitive paradigm (task)
Self evaluation task
Map type
Z
- N
Comprehensive Income by Age Group Dataset: Longitudinal Analysis of West...
- neilsberg.com
Updated Aug 7, 2024ShareFacebookTwitterEmailClick to copy linkLink copiedCiteNeilsberg Research (2024). Comprehensive Income by Age Group Dataset: Longitudinal Analysis of West Long Branch, NJ Household Incomes Across 4 Age Groups and 16 Income Brackets. Annual Editions Collection // 2024 Edition [Dataset]. https://www.neilsberg.com/research/datasets/2efaa20b-aeee-11ee-aaca-3860777c1fe6/Dataset updatedAug 7, 2024Dataset authored and provided byNeilsberg ResearchLicenseAttribution 4.0 (CC BY 4.0)https://creativecommons.org/licenses/by/4.0/
License information was derived automaticallyArea coveredWest Long Branch, New JerseyDataset funded byNeilsberg ResearchDescriptionAbout this dataset
Context
The dataset tabulates the West Long Branch household income by age. The dataset can be utilized to understand the age-based income distribution of West Long Branch income.
Content
The dataset will have the following datasets when applicable
Please note: The 2020 1-Year ACS estimates data was not reported by the Census Bureau due to the impact on survey collection and analysis caused by COVID-19. Consequently, median household income data for 2020 is unavailable for large cities (population 65,000 and above).
- West Long Branch, NJ annual median income by age groups dataset (in 2022 inflation-adjusted dollars)
- Age-wise distribution of West Long Branch, NJ household incomes: Comparative analysis across 16 income brackets
Good to know
Margin of Error
Data in the dataset are based on the estimates and are subject to sampling variability and thus a margin of error. Neilsberg Research recommends using caution when presening these estimates in your research.
Custom data
If you do need custom data for any of your research project, report or presentation, you can contact our research staff at research@neilsberg.com for a feasibility of a custom tabulation on a fee-for-service basis.
Inspiration
Neilsberg Research Team curates, analyze and publishes demographics and economic data from a variety of public and proprietary sources, each of which often includes multiple surveys and programs. The large majority of Neilsberg Research aggregated datasets and insights is made available for free download at https://www.neilsberg.com/research/.
Interested in deeper insights and visual analysis?
Explore our comprehensive data analysis and visual representations for a deeper understanding of West Long Branch income distribution by age. You can refer the same here
- N
Individual Brain Charting dataset extension, second release of...
- neurovault.org
niftiUpdated Feb 14, 2020ShareFacebookTwitterEmailClick to copy linkLink copiedCite(2020). Individual Brain Charting dataset extension, second release of high-resolution fMRI data for cognitive mapping: sub-04_ses-21_task-self_dir-pa_run-02_encode_other [Dataset]. http://identifiers.org/neurovault.image:364861niftiAvailable download formatsUnique identifierhttps://identifiers.org/neurovault.image:364861Dataset updatedFeb 14, 2020LicenseCC0 1.0 Universal Public Domain Dedicationhttps://creativecommons.org/publicdomain/zero/1.0/
License information was derived automaticallyDescription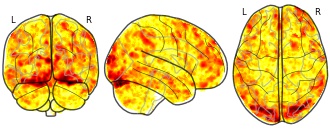
Collection description
The individual Brain Charting (IBC) Project is using high resolution fMRI to map 13 subjects that undergo a large number of tasks: the HCP tasks, the so-called ARCHI tasks, a specific language task, video watching, low-level visual stimulation etc. The native resolution of the data is 1.5mm isotropic. Their main value lies in the large number of contrasts probed, the level of detail and the high SNR per subject. This dataset is meant to provide the basis of a functional brain atlas. We upload here smoothed individual SPMs. The uploaded maps comprise session-specific and fixed effects across maps acquired with AP and PA phase encoding directions.
Note that Neurovault collection #4438 is a subset of that one. In the present collections, some details have been fixed, including mroe accurate and unique file naming.
Subject species
homo sapiens
Modality
fMRI-BOLD
Analysis level
single-subject
Cognitive paradigm (task)
Self evaluation task
Map type
Z
- N
Comprehensive Income by Age Group Dataset: Longitudinal Analysis of Big...
- neilsberg.com
Updated Aug 7, 2024ShareFacebookTwitterEmailClick to copy linkLink copiedCiteNeilsberg Research (2024). Comprehensive Income by Age Group Dataset: Longitudinal Analysis of Big Spring, TX Household Incomes Across 4 Age Groups and 16 Income Brackets. Annual Editions Collection // 2024 Edition [Dataset]. https://www.neilsberg.com/research/datasets/2ebda39a-aeee-11ee-aaca-3860777c1fe6/Dataset updatedAug 7, 2024Dataset authored and provided byNeilsberg ResearchLicenseAttribution 4.0 (CC BY 4.0)https://creativecommons.org/licenses/by/4.0/
License information was derived automaticallyArea coveredBig Spring, TexasDataset funded byNeilsberg ResearchDescriptionAbout this dataset
Context
The dataset tabulates the Big Spring household income by age. The dataset can be utilized to understand the age-based income distribution of Big Spring income.
Content
The dataset will have the following datasets when applicable
Please note: The 2020 1-Year ACS estimates data was not reported by the Census Bureau due to the impact on survey collection and analysis caused by COVID-19. Consequently, median household income data for 2020 is unavailable for large cities (population 65,000 and above).
- Big Spring, TX annual median income by age groups dataset (in 2022 inflation-adjusted dollars)
- Age-wise distribution of Big Spring, TX household incomes: Comparative analysis across 16 income brackets
Good to know
Margin of Error
Data in the dataset are based on the estimates and are subject to sampling variability and thus a margin of error. Neilsberg Research recommends using caution when presening these estimates in your research.
Custom data
If you do need custom data for any of your research project, report or presentation, you can contact our research staff at research@neilsberg.com for a feasibility of a custom tabulation on a fee-for-service basis.
Inspiration
Neilsberg Research Team curates, analyze and publishes demographics and economic data from a variety of public and proprietary sources, each of which often includes multiple surveys and programs. The large majority of Neilsberg Research aggregated datasets and insights is made available for free download at https://www.neilsberg.com/research/.
Interested in deeper insights and visual analysis?
Explore our comprehensive data analysis and visual representations for a deeper understanding of Big Spring income distribution by age. You can refer the same here
- N
Individual Brain Charting dataset extension, second release of...
- neurovault.org
niftiUpdated Feb 14, 2020ShareFacebookTwitterEmailClick to copy linkLink copiedCite(2020). Individual Brain Charting dataset extension, second release of high-resolution fMRI data for cognitive mapping: sub-04_ses-21_task-self_dir-ap_run-03_false_alarm [Dataset]. http://identifiers.org/neurovault.image:361292niftiAvailable download formatsUnique identifierhttps://identifiers.org/neurovault.image:361292Dataset updatedFeb 14, 2020LicenseCC0 1.0 Universal Public Domain Dedicationhttps://creativecommons.org/publicdomain/zero/1.0/
License information was derived automaticallyDescription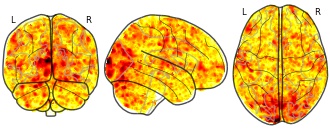
Collection description
The individual Brain Charting (IBC) Project is using high resolution fMRI to map 13 subjects that undergo a large number of tasks: the HCP tasks, the so-called ARCHI tasks, a specific language task, video watching, low-level visual stimulation etc. The native resolution of the data is 1.5mm isotropic. Their main value lies in the large number of contrasts probed, the level of detail and the high SNR per subject. This dataset is meant to provide the basis of a functional brain atlas. We upload here smoothed individual SPMs. The uploaded maps comprise session-specific and fixed effects across maps acquired with AP and PA phase encoding directions.
Note that Neurovault collection #4438 is a subset of that one. In the present collections, some details have been fixed, including mroe accurate and unique file naming.
Subject species
homo sapiens
Modality
fMRI-BOLD
Analysis level
single-subject
Cognitive paradigm (task)
Self evaluation task
Map type
Z
- N
Comprehensive Income by Age Group Dataset: Longitudinal Analysis of Long...
- neilsberg.com
Updated Aug 7, 2024ShareFacebookTwitterEmailClick to copy linkLink copiedCiteNeilsberg Research (2024). Comprehensive Income by Age Group Dataset: Longitudinal Analysis of Long Grove, IL Household Incomes Across 4 Age Groups and 16 Income Brackets. Annual Editions Collection // 2024 Edition [Dataset]. https://www.neilsberg.com/research/datasets/2edd7c0f-aeee-11ee-aaca-3860777c1fe6/Dataset updatedAug 7, 2024Dataset authored and provided byNeilsberg ResearchLicenseAttribution 4.0 (CC BY 4.0)https://creativecommons.org/licenses/by/4.0/
License information was derived automaticallyArea coveredLong Grove, IllinoisDataset funded byNeilsberg ResearchDescriptionAbout this dataset
Context
The dataset tabulates the Long Grove household income by age. The dataset can be utilized to understand the age-based income distribution of Long Grove income.
Content
The dataset will have the following datasets when applicable
Please note: The 2020 1-Year ACS estimates data was not reported by the Census Bureau due to the impact on survey collection and analysis caused by COVID-19. Consequently, median household income data for 2020 is unavailable for large cities (population 65,000 and above).
- Long Grove, IL annual median income by age groups dataset (in 2022 inflation-adjusted dollars)
- Age-wise distribution of Long Grove, IL household incomes: Comparative analysis across 16 income brackets
Good to know
Margin of Error
Data in the dataset are based on the estimates and are subject to sampling variability and thus a margin of error. Neilsberg Research recommends using caution when presening these estimates in your research.
Custom data
If you do need custom data for any of your research project, report or presentation, you can contact our research staff at research@neilsberg.com for a feasibility of a custom tabulation on a fee-for-service basis.
Inspiration
Neilsberg Research Team curates, analyze and publishes demographics and economic data from a variety of public and proprietary sources, each of which often includes multiple surveys and programs. The large majority of Neilsberg Research aggregated datasets and insights is made available for free download at https://www.neilsberg.com/research/.
Interested in deeper insights and visual analysis?
Explore our comprehensive data analysis and visual representations for a deeper understanding of Long Grove income distribution by age. You can refer the same here
- N
Individual Brain Charting dataset extension, second release of...
- neurovault.org
niftiUpdated Feb 14, 2020ShareFacebookTwitterEmailClick to copy linkLink copiedCite(2020). Individual Brain Charting dataset extension, second release of high-resolution fMRI data for cognitive mapping: sub-04_ses-21_task-self_dir-ap_run-03_encode_self [Dataset]. http://identifiers.org/neurovault.image:361274niftiAvailable download formatsUnique identifierhttps://identifiers.org/neurovault.image:361274Dataset updatedFeb 14, 2020LicenseCC0 1.0 Universal Public Domain Dedicationhttps://creativecommons.org/publicdomain/zero/1.0/
License information was derived automaticallyDescription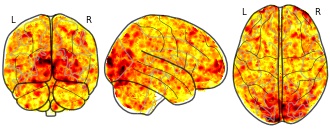
Collection description
The individual Brain Charting (IBC) Project is using high resolution fMRI to map 13 subjects that undergo a large number of tasks: the HCP tasks, the so-called ARCHI tasks, a specific language task, video watching, low-level visual stimulation etc. The native resolution of the data is 1.5mm isotropic. Their main value lies in the large number of contrasts probed, the level of detail and the high SNR per subject. This dataset is meant to provide the basis of a functional brain atlas. We upload here smoothed individual SPMs. The uploaded maps comprise session-specific and fixed effects across maps acquired with AP and PA phase encoding directions.
Note that Neurovault collection #4438 is a subset of that one. In the present collections, some details have been fixed, including mroe accurate and unique file naming.
Subject species
homo sapiens
Modality
fMRI-BOLD
Analysis level
single-subject
Cognitive paradigm (task)
Self evaluation task
Map type
Z
- N
Individual Brain Charting dataset extension, second release of...
- neurovault.org
niftiUpdated Feb 14, 2020ShareFacebookTwitterEmailClick to copy linkLink copiedCite(2020). Individual Brain Charting dataset extension, second release of high-resolution fMRI data for cognitive mapping: sub-11_ses-22_task-self_dir-ap_run-03_recognition_self_hit [Dataset]. http://identifiers.org/neurovault.image:362912niftiAvailable download formatsUnique identifierhttps://identifiers.org/neurovault.image:362912Dataset updatedFeb 14, 2020LicenseCC0 1.0 Universal Public Domain Dedicationhttps://creativecommons.org/publicdomain/zero/1.0/
License information was derived automaticallyDescription
Collection description
The individual Brain Charting (IBC) Project is using high resolution fMRI to map 13 subjects that undergo a large number of tasks: the HCP tasks, the so-called ARCHI tasks, a specific language task, video watching, low-level visual stimulation etc. The native resolution of the data is 1.5mm isotropic. Their main value lies in the large number of contrasts probed, the level of detail and the high SNR per subject. This dataset is meant to provide the basis of a functional brain atlas. We upload here smoothed individual SPMs. The uploaded maps comprise session-specific and fixed effects across maps acquired with AP and PA phase encoding directions.
Note that Neurovault collection #4438 is a subset of that one. In the present collections, some details have been fixed, including mroe accurate and unique file naming.
Subject species
homo sapiens
Modality
fMRI-BOLD
Analysis level
single-subject
Cognitive paradigm (task)
Self evaluation task
Map type
Z
- N
Big Flats, Wisconsin Population Growth and Demographic Trends Dataset:...
- neilsberg.com
Updated Jul 30, 2024+ more versionsShareFacebookTwitterEmailClick to copy linkLink copiedCiteNeilsberg Research (2024). Big Flats, Wisconsin Population Growth and Demographic Trends Dataset: Annual Editions Collection // Editions 2000-2024 [Dataset]. https://www.neilsberg.com/research/datasets/bc1bb26a-55e4-11ee-9c55-3860777c1fe6/Dataset updatedJul 30, 2024Dataset authored and provided byNeilsberg ResearchLicenseAttribution 4.0 (CC BY 4.0)https://creativecommons.org/licenses/by/4.0/
License information was derived automaticallyArea coveredWisconsin, Big FlatsDataset funded byNeilsberg ResearchDescriptionAbout this dataset
Context
The dataset tabulates the Big Flats town population by year. The dataset can be utilized to understand the population trend of Big Flats town.
Content
The dataset constitues the following datasets
- Big Flats, Wisconsin Population Dataset: Yearly Figures, Population Change, and Percent Change Analysis
Good to know
Margin of Error
Data in the dataset are based on the estimates and are subject to sampling variability and thus a margin of error. Neilsberg Research recommends using caution when presening these estimates in your research.
Custom data
If you do need custom data for any of your research project, report or presentation, you can contact our research staff at research@neilsberg.com for a feasibility of a custom tabulation on a fee-for-service basis.
Inspiration
Neilsberg Research Team curates, analyze and publishes demographics and economic data from a variety of public and proprietary sources, each of which often includes multiple surveys and programs. The large majority of Neilsberg Research aggregated datasets and insights is made available for free download at https://www.neilsberg.com/research/.
- N
Comprehensive Income by Age Group Dataset: Longitudinal Analysis of Long...
- neilsberg.com
Updated Aug 7, 2024+ more versionsShareFacebookTwitterEmailClick to copy linkLink copiedCiteNeilsberg Research (2024). Comprehensive Income by Age Group Dataset: Longitudinal Analysis of Long Creek, IL Household Incomes Across 4 Age Groups and 16 Income Brackets. Annual Editions Collection // 2024 Edition [Dataset]. https://www.neilsberg.com/research/datasets/2edd7ab6-aeee-11ee-aaca-3860777c1fe6/Dataset updatedAug 7, 2024Dataset authored and provided byNeilsberg ResearchLicenseAttribution 4.0 (CC BY 4.0)https://creativecommons.org/licenses/by/4.0/
License information was derived automaticallyArea coveredLong Creek, IllinoisDataset funded byNeilsberg ResearchDescriptionAbout this dataset
Context
The dataset tabulates the Long Creek household income by age. The dataset can be utilized to understand the age-based income distribution of Long Creek income.
Content
The dataset will have the following datasets when applicable
Please note: The 2020 1-Year ACS estimates data was not reported by the Census Bureau due to the impact on survey collection and analysis caused by COVID-19. Consequently, median household income data for 2020 is unavailable for large cities (population 65,000 and above).
- Long Creek, IL annual median income by age groups dataset (in 2022 inflation-adjusted dollars)
- Age-wise distribution of Long Creek, IL household incomes: Comparative analysis across 16 income brackets
Good to know
Margin of Error
Data in the dataset are based on the estimates and are subject to sampling variability and thus a margin of error. Neilsberg Research recommends using caution when presening these estimates in your research.
Custom data
If you do need custom data for any of your research project, report or presentation, you can contact our research staff at research@neilsberg.com for a feasibility of a custom tabulation on a fee-for-service basis.
Inspiration
Neilsberg Research Team curates, analyze and publishes demographics and economic data from a variety of public and proprietary sources, each of which often includes multiple surveys and programs. The large majority of Neilsberg Research aggregated datasets and insights is made available for free download at https://www.neilsberg.com/research/.
Interested in deeper insights and visual analysis?
Explore our comprehensive data analysis and visual representations for a deeper understanding of Long Creek income distribution by age. You can refer the same here
- N
Big Lake, MO Population Growth and Demographic Trends Dataset: Annual...
- neilsberg.com
Updated Jul 30, 2024ShareFacebookTwitterEmailClick to copy linkLink copiedCiteNeilsberg Research (2024). Big Lake, MO Population Growth and Demographic Trends Dataset: Annual Editions Collection // Editions 2000-2024 [Dataset]. https://www.neilsberg.com/research/datasets/bc1bb62b-55e4-11ee-9c55-3860777c1fe6/Dataset updatedJul 30, 2024Dataset authored and provided byNeilsberg ResearchLicenseAttribution 4.0 (CC BY 4.0)https://creativecommons.org/licenses/by/4.0/
License information was derived automaticallyArea coveredMissouri, Big LakeDataset funded byNeilsberg ResearchDescriptionAbout this dataset
Context
The dataset tabulates the Big Lake population by year. The dataset can be utilized to understand the population trend of Big Lake.
Content
The dataset constitues the following datasets
- Big Lake, MO Population Dataset: Yearly Figures, Population Change, and Percent Change Analysis
Good to know
Margin of Error
Data in the dataset are based on the estimates and are subject to sampling variability and thus a margin of error. Neilsberg Research recommends using caution when presening these estimates in your research.
Custom data
If you do need custom data for any of your research project, report or presentation, you can contact our research staff at research@neilsberg.com for a feasibility of a custom tabulation on a fee-for-service basis.
Inspiration
Neilsberg Research Team curates, analyze and publishes demographics and economic data from a variety of public and proprietary sources, each of which often includes multiple surveys and programs. The large majority of Neilsberg Research aggregated datasets and insights is made available for free download at https://www.neilsberg.com/research/.
- N
Big Rock, IL Population Breakdown by Race
- neilsberg.com
csv, jsonUpdated Aug 18, 2023+ more versionsShareFacebookTwitterEmailClick to copy linkLink copiedCiteNeilsberg Research (2023). Big Rock, IL Population Breakdown by Race [Dataset]. https://www.neilsberg.com/research/datasets/688e11a3-3d85-11ee-9abe-0aa64bf2eeb2/json, csvAvailable download formatsDataset updatedAug 18, 2023Dataset authored and provided byNeilsberg ResearchLicenseAttribution 4.0 (CC BY 4.0)https://creativecommons.org/licenses/by/4.0/
License information was derived automaticallyArea coveredBig Rock, IllinoisVariables measuredAsian Population, Black Population, White Population, Some other race Population, Two or more races Population, American Indian and Alaska Native Population, Asian Population as Percent of Total Population, Black Population as Percent of Total Population, White Population as Percent of Total Population, Native Hawaiian and Other Pacific Islander Population, and 4 moreMeasurement techniqueThe data presented in this dataset is derived from the latest U.S. Census Bureau American Community Survey (ACS) 2017-2021 5-Year Estimates. To measure the two variables, namely (a) population and (b) population as a percentage of the total population, we initially analyzed and categorized the data for each of the racial categories idetified by the US Census Bureau. It is ensured that the population estimates used in this dataset pertain exclusively to the identified racial categories, and do not rely on any ethnicity classification. For further information regarding these estimates, please feel free to reach out to us via email at research@neilsberg.com.Dataset funded byNeilsberg ResearchDescriptionAbout this dataset
Context
The dataset tabulates the population of Big Rock by race. It includes the population of Big Rock across racial categories (excluding ethnicity) as identified by the Census Bureau. The dataset can be utilized to understand the population distribution of Big Rock across relevant racial categories.
Key observations
The percent distribution of Big Rock population by race (across all racial categories recognized by the U.S. Census Bureau): 94.12% are white, 0.17% are American Indian and Alaska Native, 0.58% are Asian, 0.25% are some other race and 4.88% are multiracial.
https://i.neilsberg.com/ch/big-rock-il-population-by-race.jpeg" alt="Big Rock population by race">
Content
When available, the data consists of estimates from the U.S. Census Bureau American Community Survey (ACS) 2017-2021 5-Year Estimates.
Racial categories include:
- White
- Black or African American
- American Indian and Alaska Native
- Asian
- Native Hawaiian and Other Pacific Islander
- Some other race
- Two or more races (multiracial)
Variables / Data Columns
- Race: This column displays the racial categories (excluding ethnicity) for the Big Rock
- Population: The population of the racial category (excluding ethnicity) in the Big Rock is shown in this column.
- % of Total Population: This column displays the percentage distribution of each race as a proportion of Big Rock total population. Please note that the sum of all percentages may not equal one due to rounding of values.
Good to know
Margin of Error
Data in the dataset are based on the estimates and are subject to sampling variability and thus a margin of error. Neilsberg Research recommends using caution when presening these estimates in your research.
Custom data
If you do need custom data for any of your research project, report or presentation, you can contact our research staff at research@neilsberg.com for a feasibility of a custom tabulation on a fee-for-service basis.
Inspiration
Neilsberg Research Team curates, analyze and publishes demographics and economic data from a variety of public and proprietary sources, each of which often includes multiple surveys and programs. The large majority of Neilsberg Research aggregated datasets and insights is made available for free download at https://www.neilsberg.com/research/.
Recommended for further research
This dataset is a part of the main dataset for Big Rock Population by Race & Ethnicity. You can refer the same here
FacebookTwitterThe big dataset of ultra-marathon running
A huge collection of over 7M race records registered between 1798 and 2022
https://creativecommons.org/publicdomain/zero/1.0/https://creativecommons.org/publicdomain/zero/1.0/
According to the Wikipedia, an ultramarathon, also called ultra distance or ultra running, is any footrace longer than the traditional marathon length of 42.195 kilometres (26 mi 385 yd). Various distances are raced competitively, from the shortest common ultramarathon of 31 miles (50 km) to over 200 miles (320 km). 50k and 100k are both World Athletics record distances, but some 100 miles (160 km) races are among the oldest and most prestigious events, especially in North America.}
The data in this file is a large collection of ultra-marathon race records registered between 1798 and 2022 (a period of well over two centuries) being therefore a formidable long term sample. All data was obtained from public websites.
Despite the original data being of public domain, the race records, which originally contained the athlete´s names, have been anonymized to comply with data protection laws and to preserve the athlete´s privacy. However, a column Athlete ID has been created with a numerical ID representing each unique runner (so if Antonio Fernández participated in 5 races over different years, then the corresponding race records now hold his unique Athlete ID instead of his name). This way I have preserved valuable information.
The dataset contains 7,461,226 ultra-marathon race records from 1,641,168 unique athletes.
The following columns (with data types) are included:
- Year of event (int64)
- Event dates (object)
- Event name (object)
- Event distance/length (object)
- Event number of finishers (int64)
- Athlete performance (object)
- Athlete club (object)
- Athlete country (object)
- Athlete year of birth (float64)
- Athlete gender (object)
- Athlete age category (object)
- Athlete average speed (object)
- Athlete ID (int64)
The Event name column include country location information that can be derived to a new column, and similarly seasonal information can be found in the Event dates column beyond the Year of event (these can be extracted with a bit of processing).
The Event distance/length column describes the type of race, covering the most popular UM race distances and lengths, and some other specific modalities (multi-day, etc.):
- Distances: 50km, 100km, 50mi, 100mi
- Lengths: 6h, 12h, 24h, 48h, 72h, 6d, 10d
Additionally, there is information of age, gender and speed (in km/h) in other columns.